Citizen Science Interface
Tutorial by Jakub W. Bubnicki (OSCF)
Welcome to the Trapper Citizen Science platform! This guide will provide a comprehensive walkthrough of the essential features of our interface, from registering a new account and uploading your first set of camera trap images to classifying wildlife and managing your projects. Let’s get started! 🚀
Getting Started
If you’re new to Trapper, your first step is to create an account. If you already have one, you can jump straight to the login section.
Registration / Creating a New Account
Welcome aboard! Creating an account is simple and will get you into the action in no time.
On the main login page, click the Create an account button. This will take you to the registration form.
Fill in your details, which typically include your First name, Last name, E-mail, and a secure Password.
You will need to review and agree to the Terms of Service and Privacy Policy before proceeding.
Click the final Create an account button to submit your information.
Important
After registering, check your email inbox for a verification link to activate your account. You won’t be able to log in until you’ve completed this step.
Note
If you already have an account in the Trapper Expert module, you can log in to the Citizen Science interface using the same e-mail and password — no separate registration is required. If you still cannot access a project, contact your project administrator to grant the necessary permissions.
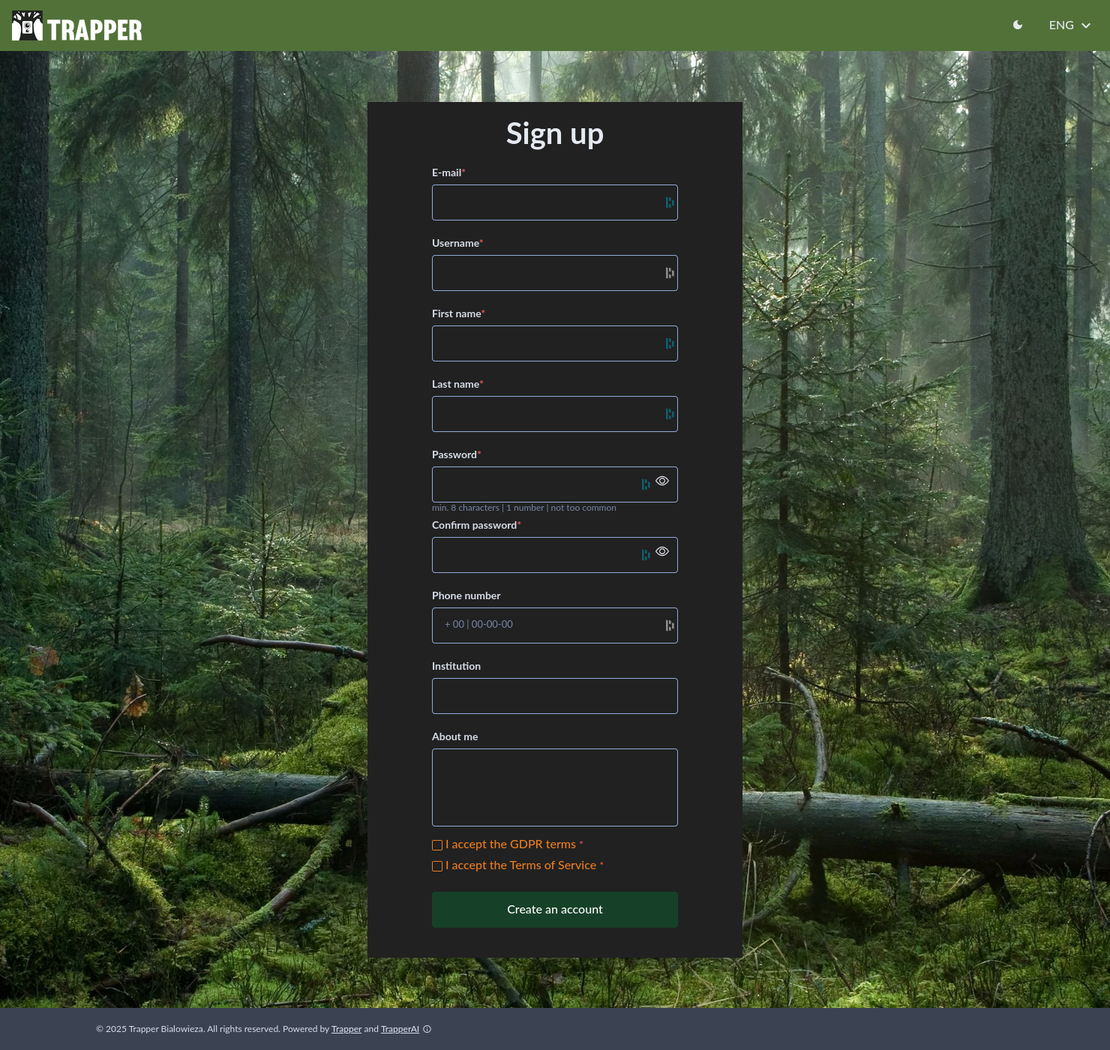
The registration form for new users.
Logging In
Once your account is activated, you can sign in.
Navigate to the Trapper login page.
Enter your E-mail and Password.
Click the Sign in button.
Note
You also have the option to sign in using a Google or Microsoft account (third-party authentication services). Please note that these social login options must be configured in advance by an administrator in the Trapper Expert admin panel.
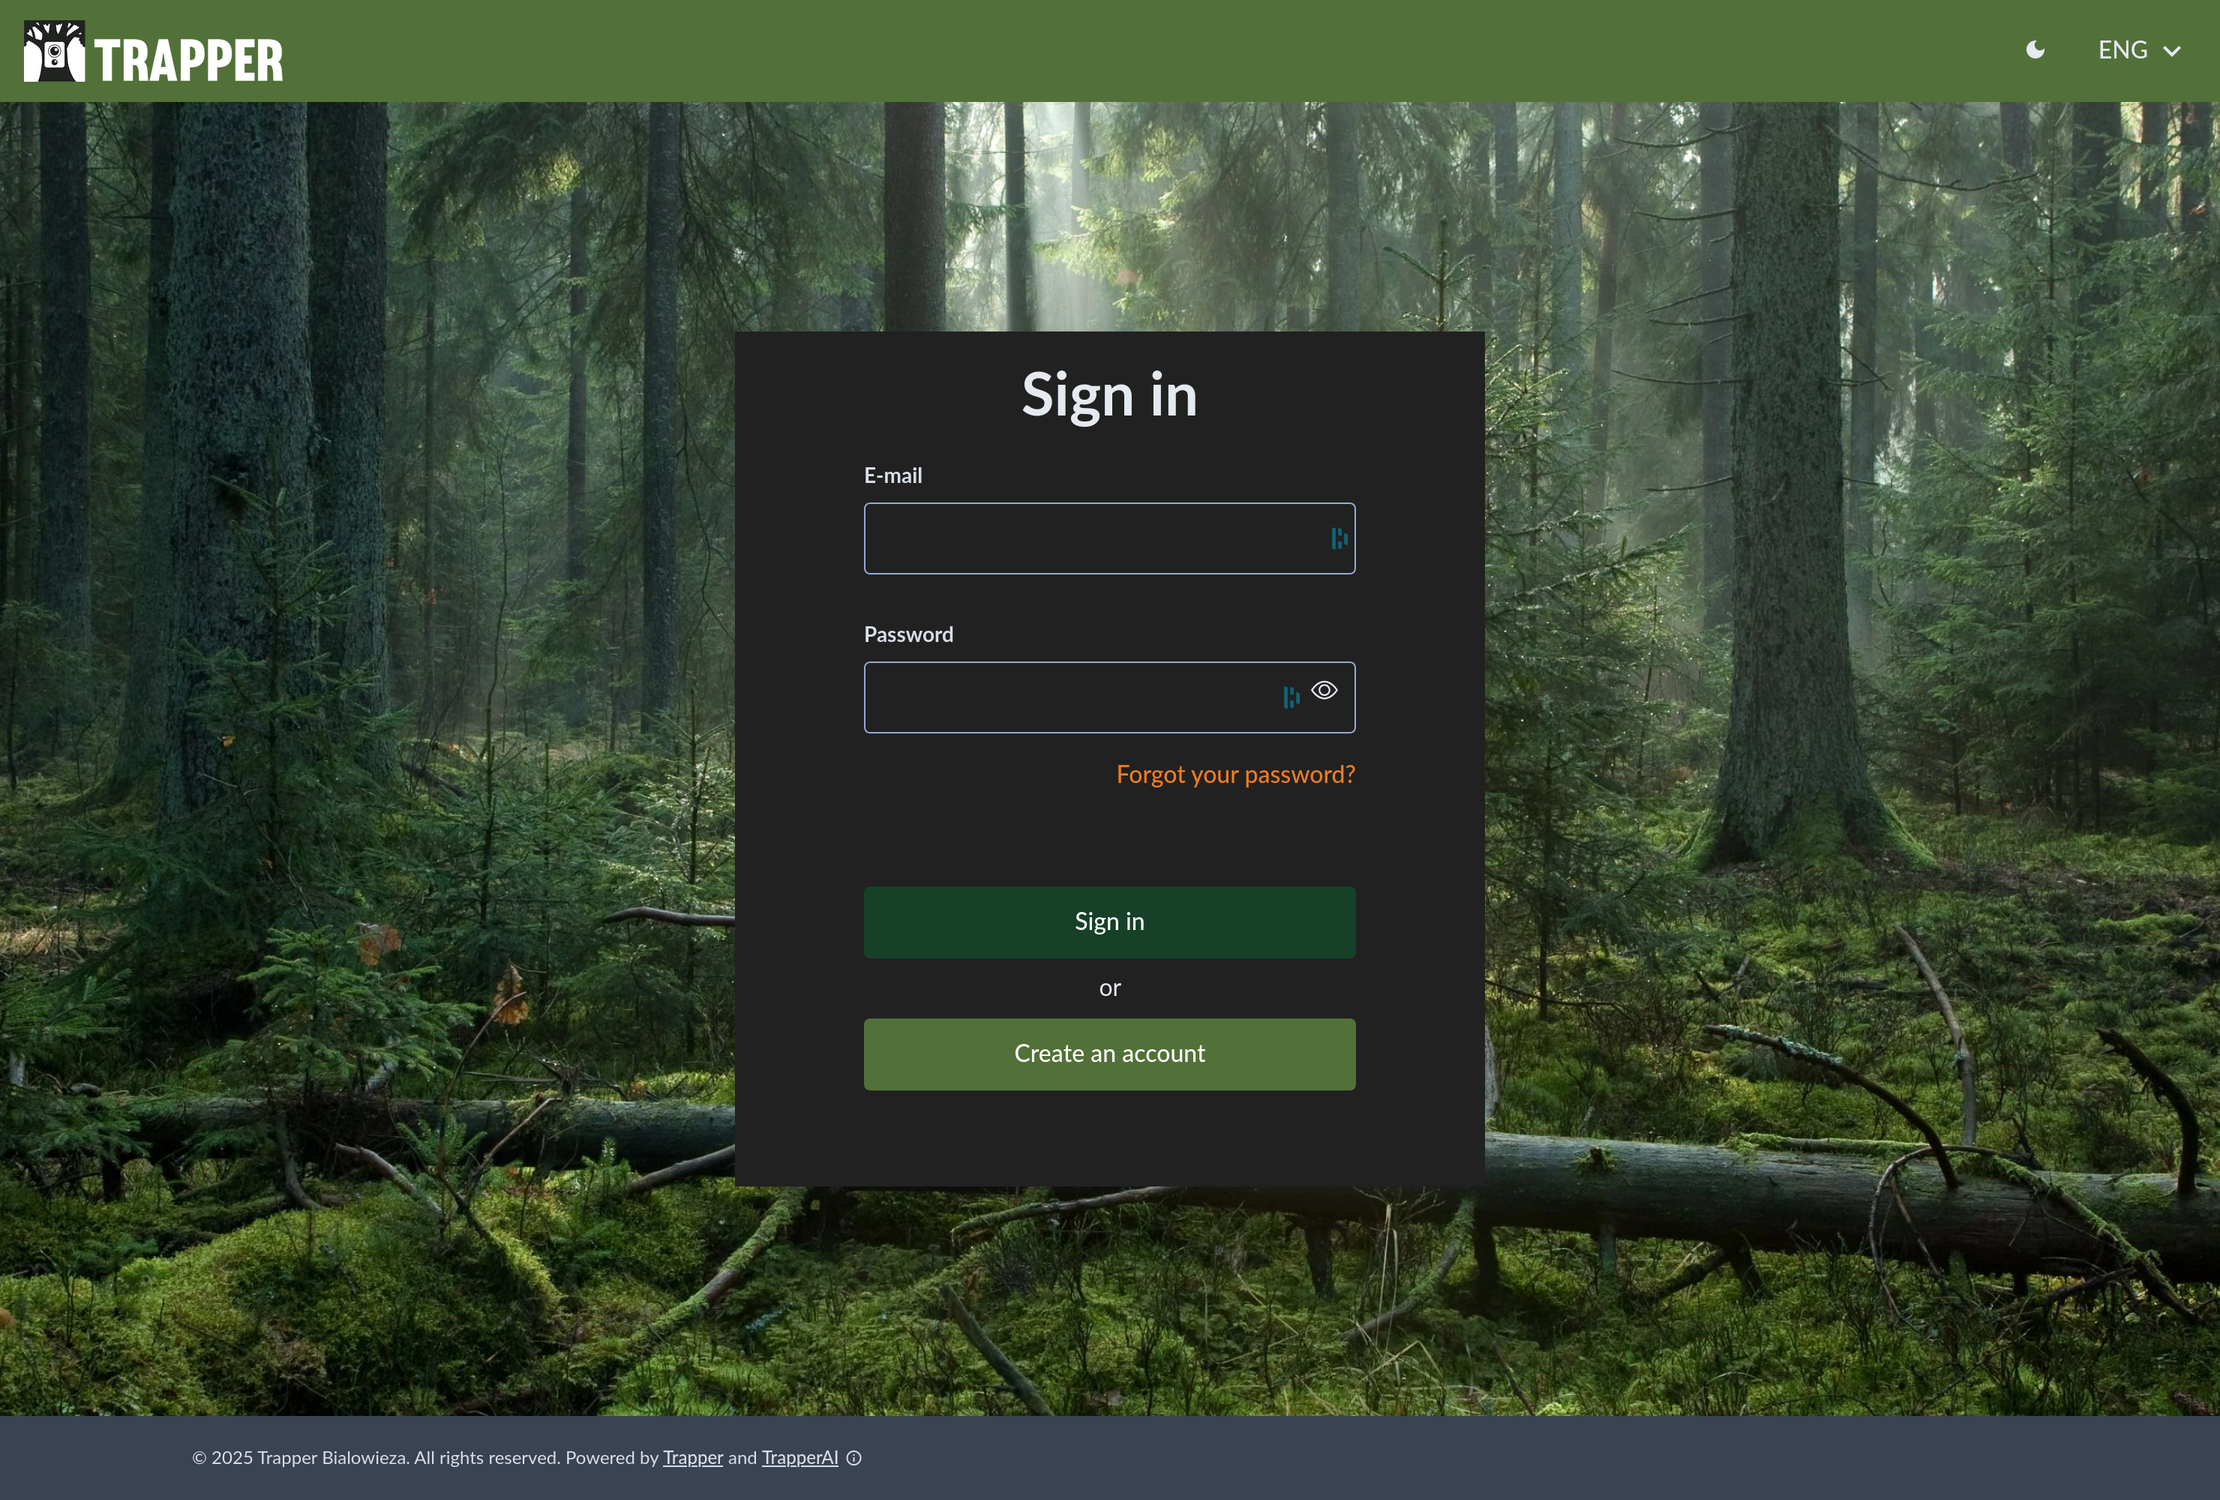
The main login screen with fields for email and password.
The Main Dashboard
After logging in, you’ll land on the Citizen Science project selection page. This is your mission control, where you can see all the projects you’re a part of. To begin working, simply click on the project you wish to access.
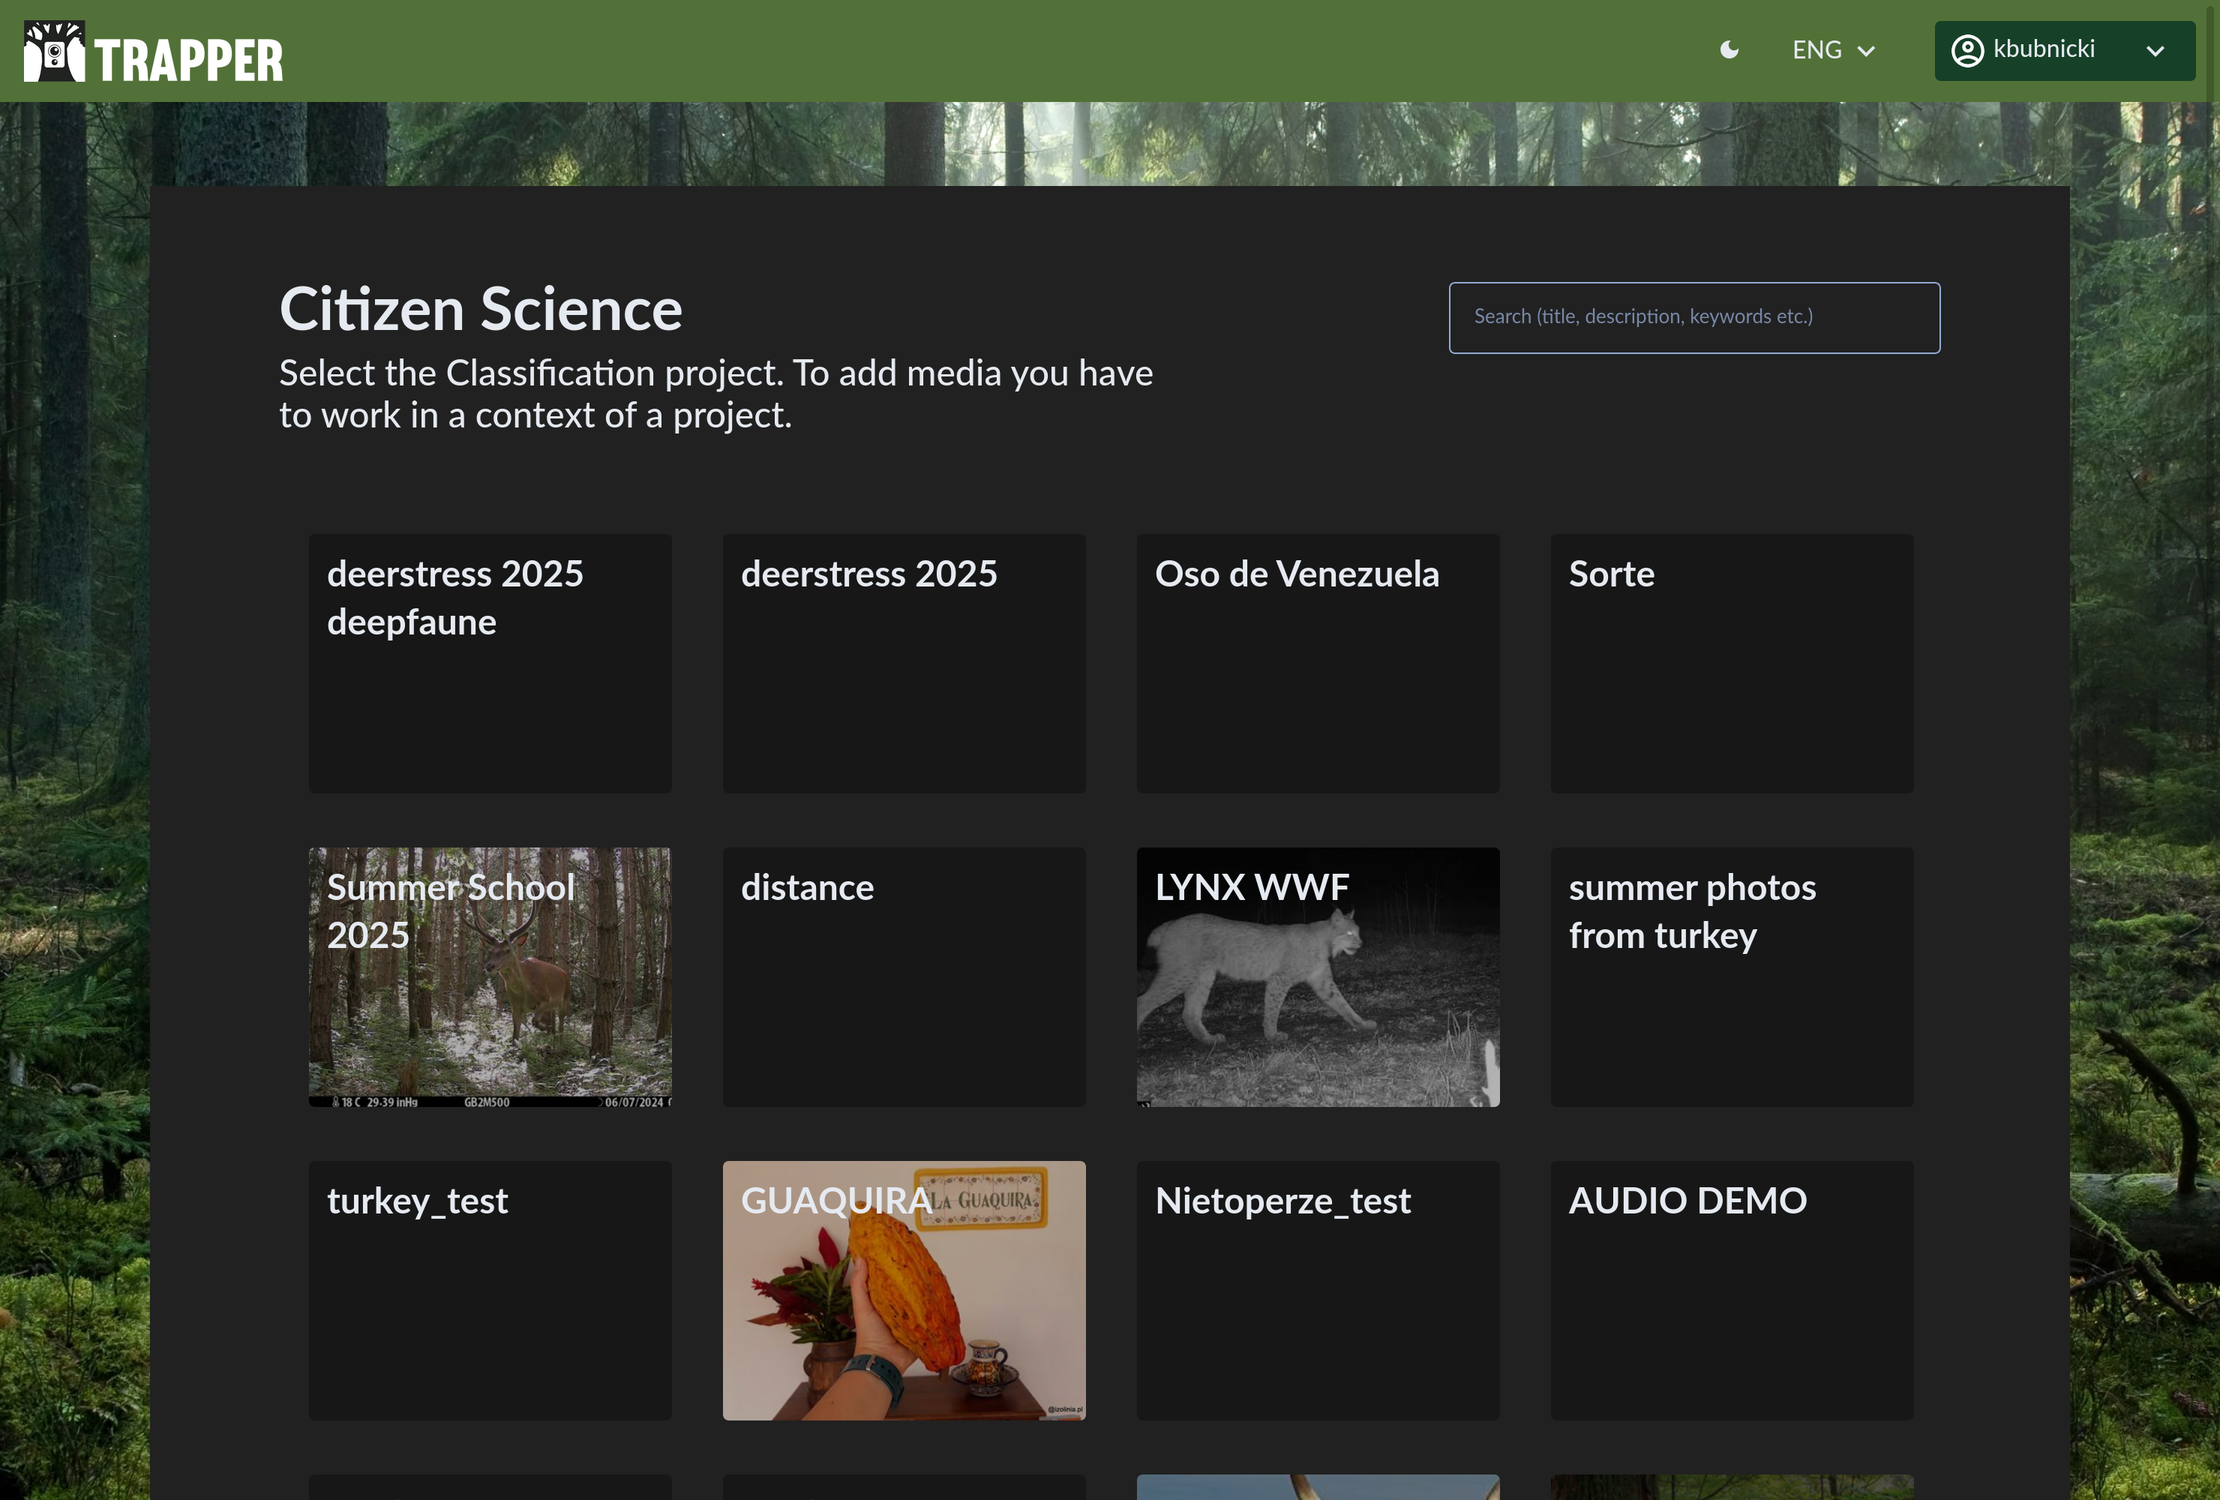
Your central hub for accessing different research projects.
Once you enter a project, you’ll see the project’s dashboard, which gives you a quick statistical overview, including the number of locations, deployments, media files, recordings, and camera traps. You can also see a bar chart that visualizes the distribution of species identified, providing an immediate insight into the biodiversity captured.
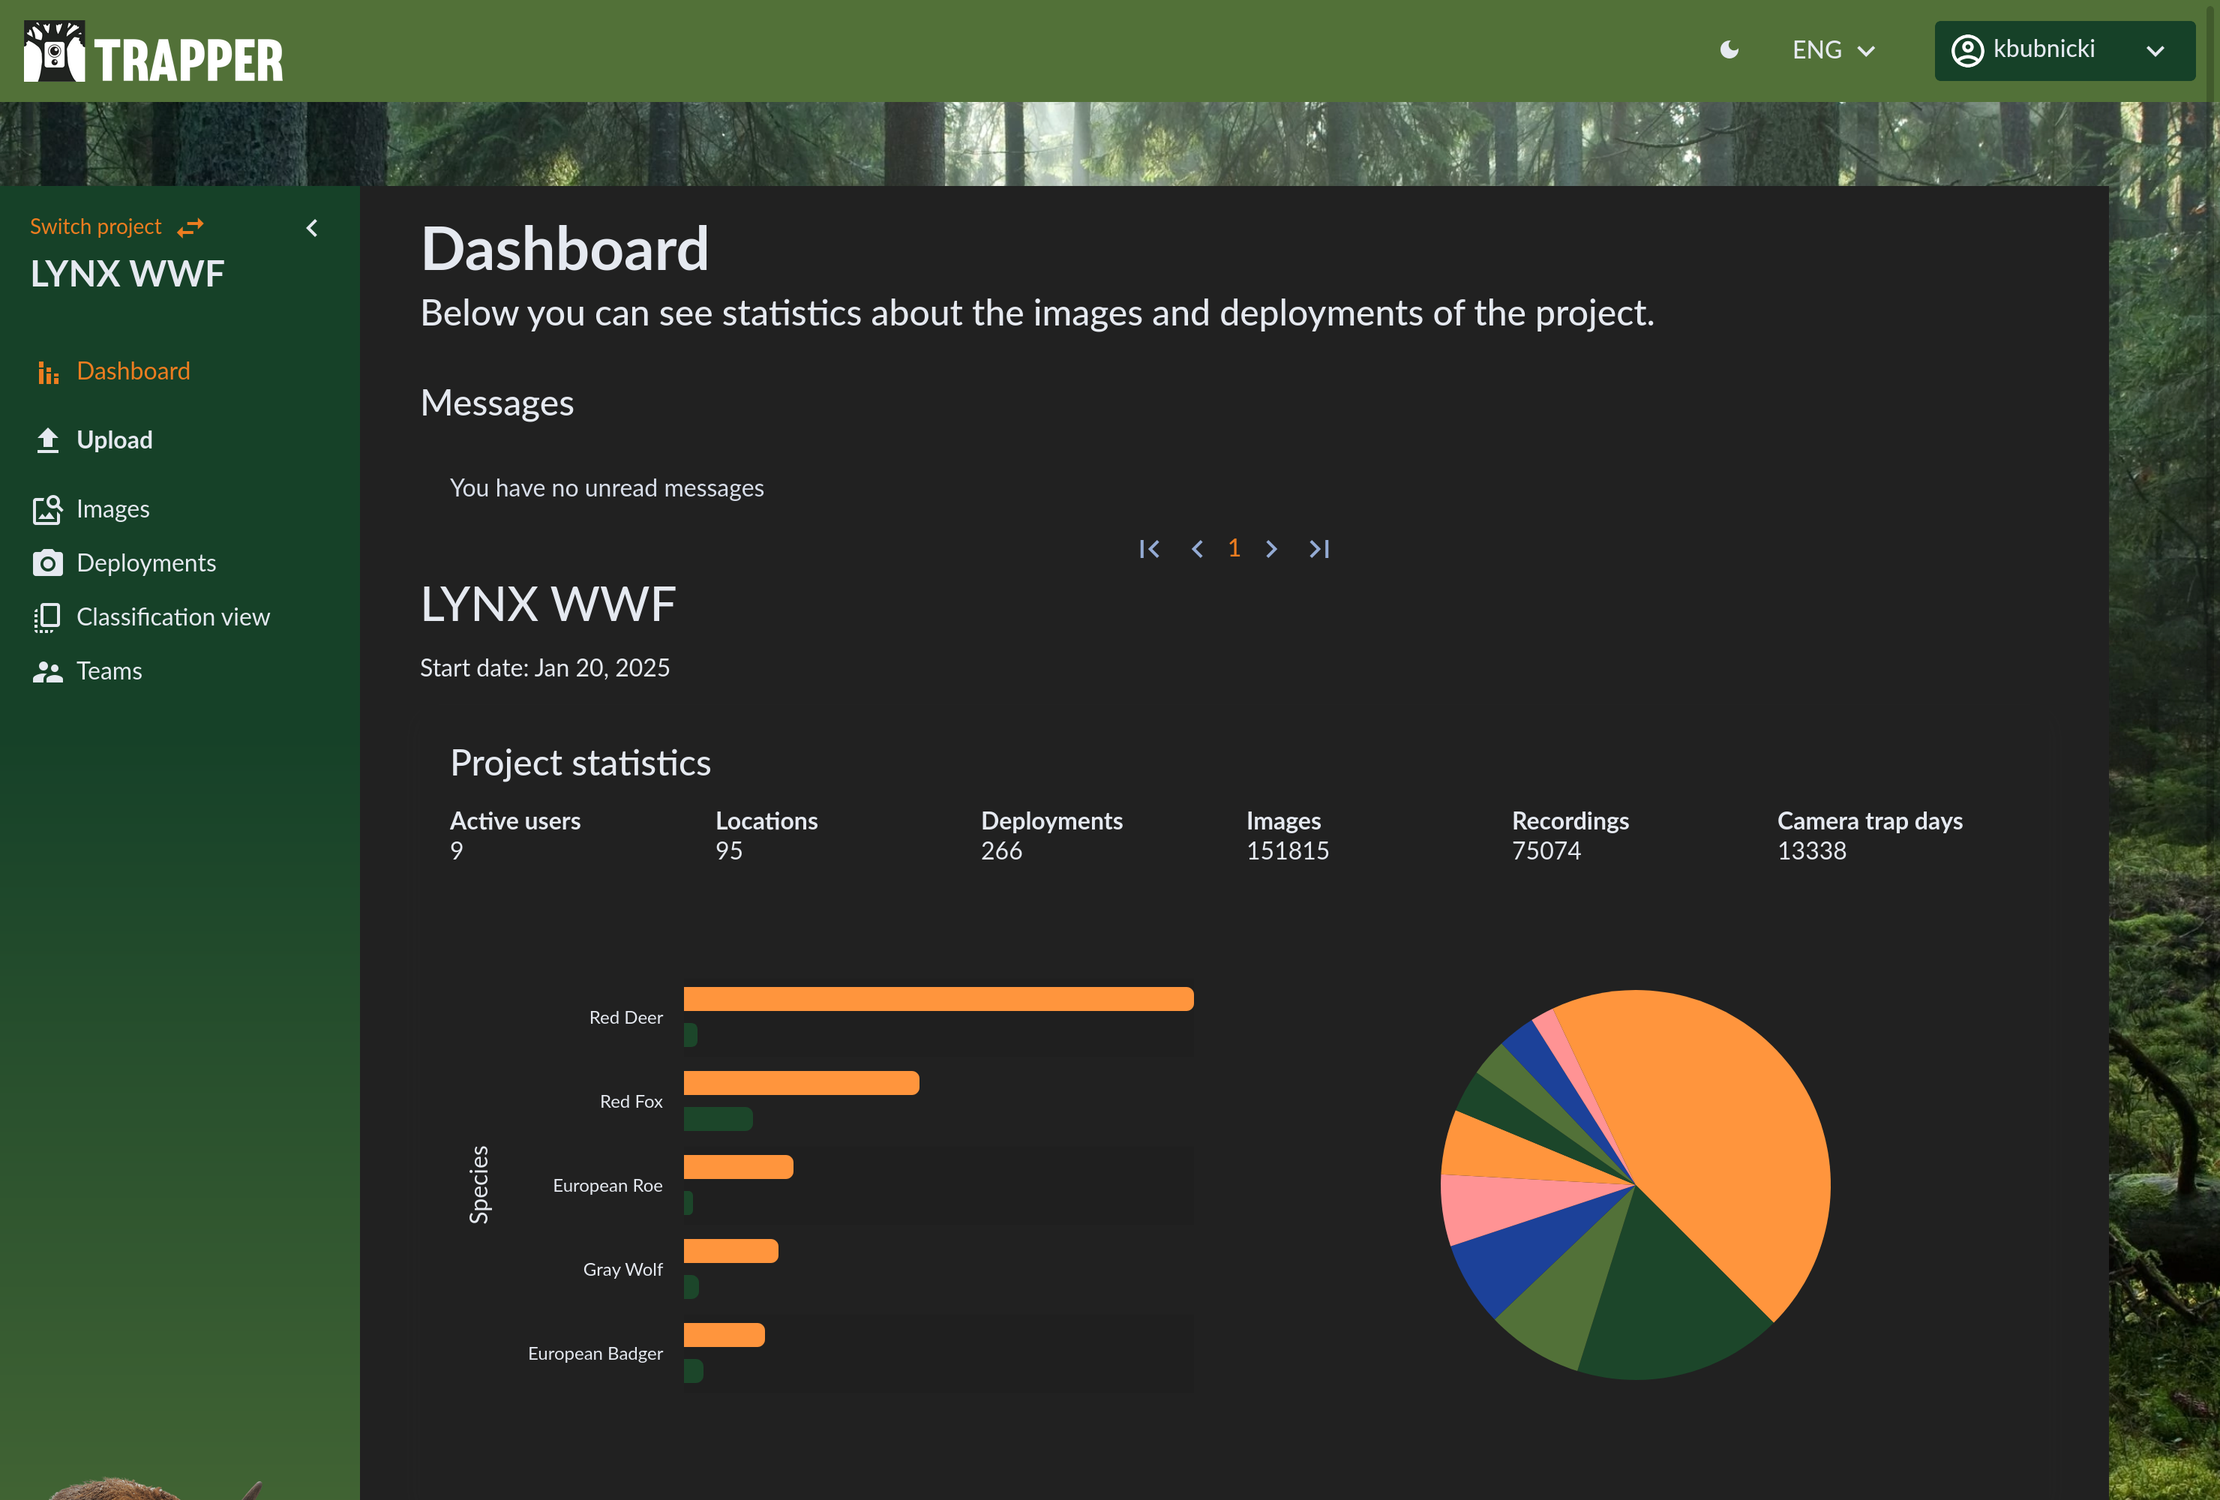
A summary of your project’s data at a glance.
Uploading Camera Trap Media
Uploading your images and videos is the first step in analyzing your data. Our uploader is designed to capture all the necessary metadata for a successful deployment.
Step 1: Start a New Upload
From the main navigation menu, go to the Upload section. This will take you to the upload form.
The starting point for adding new media.
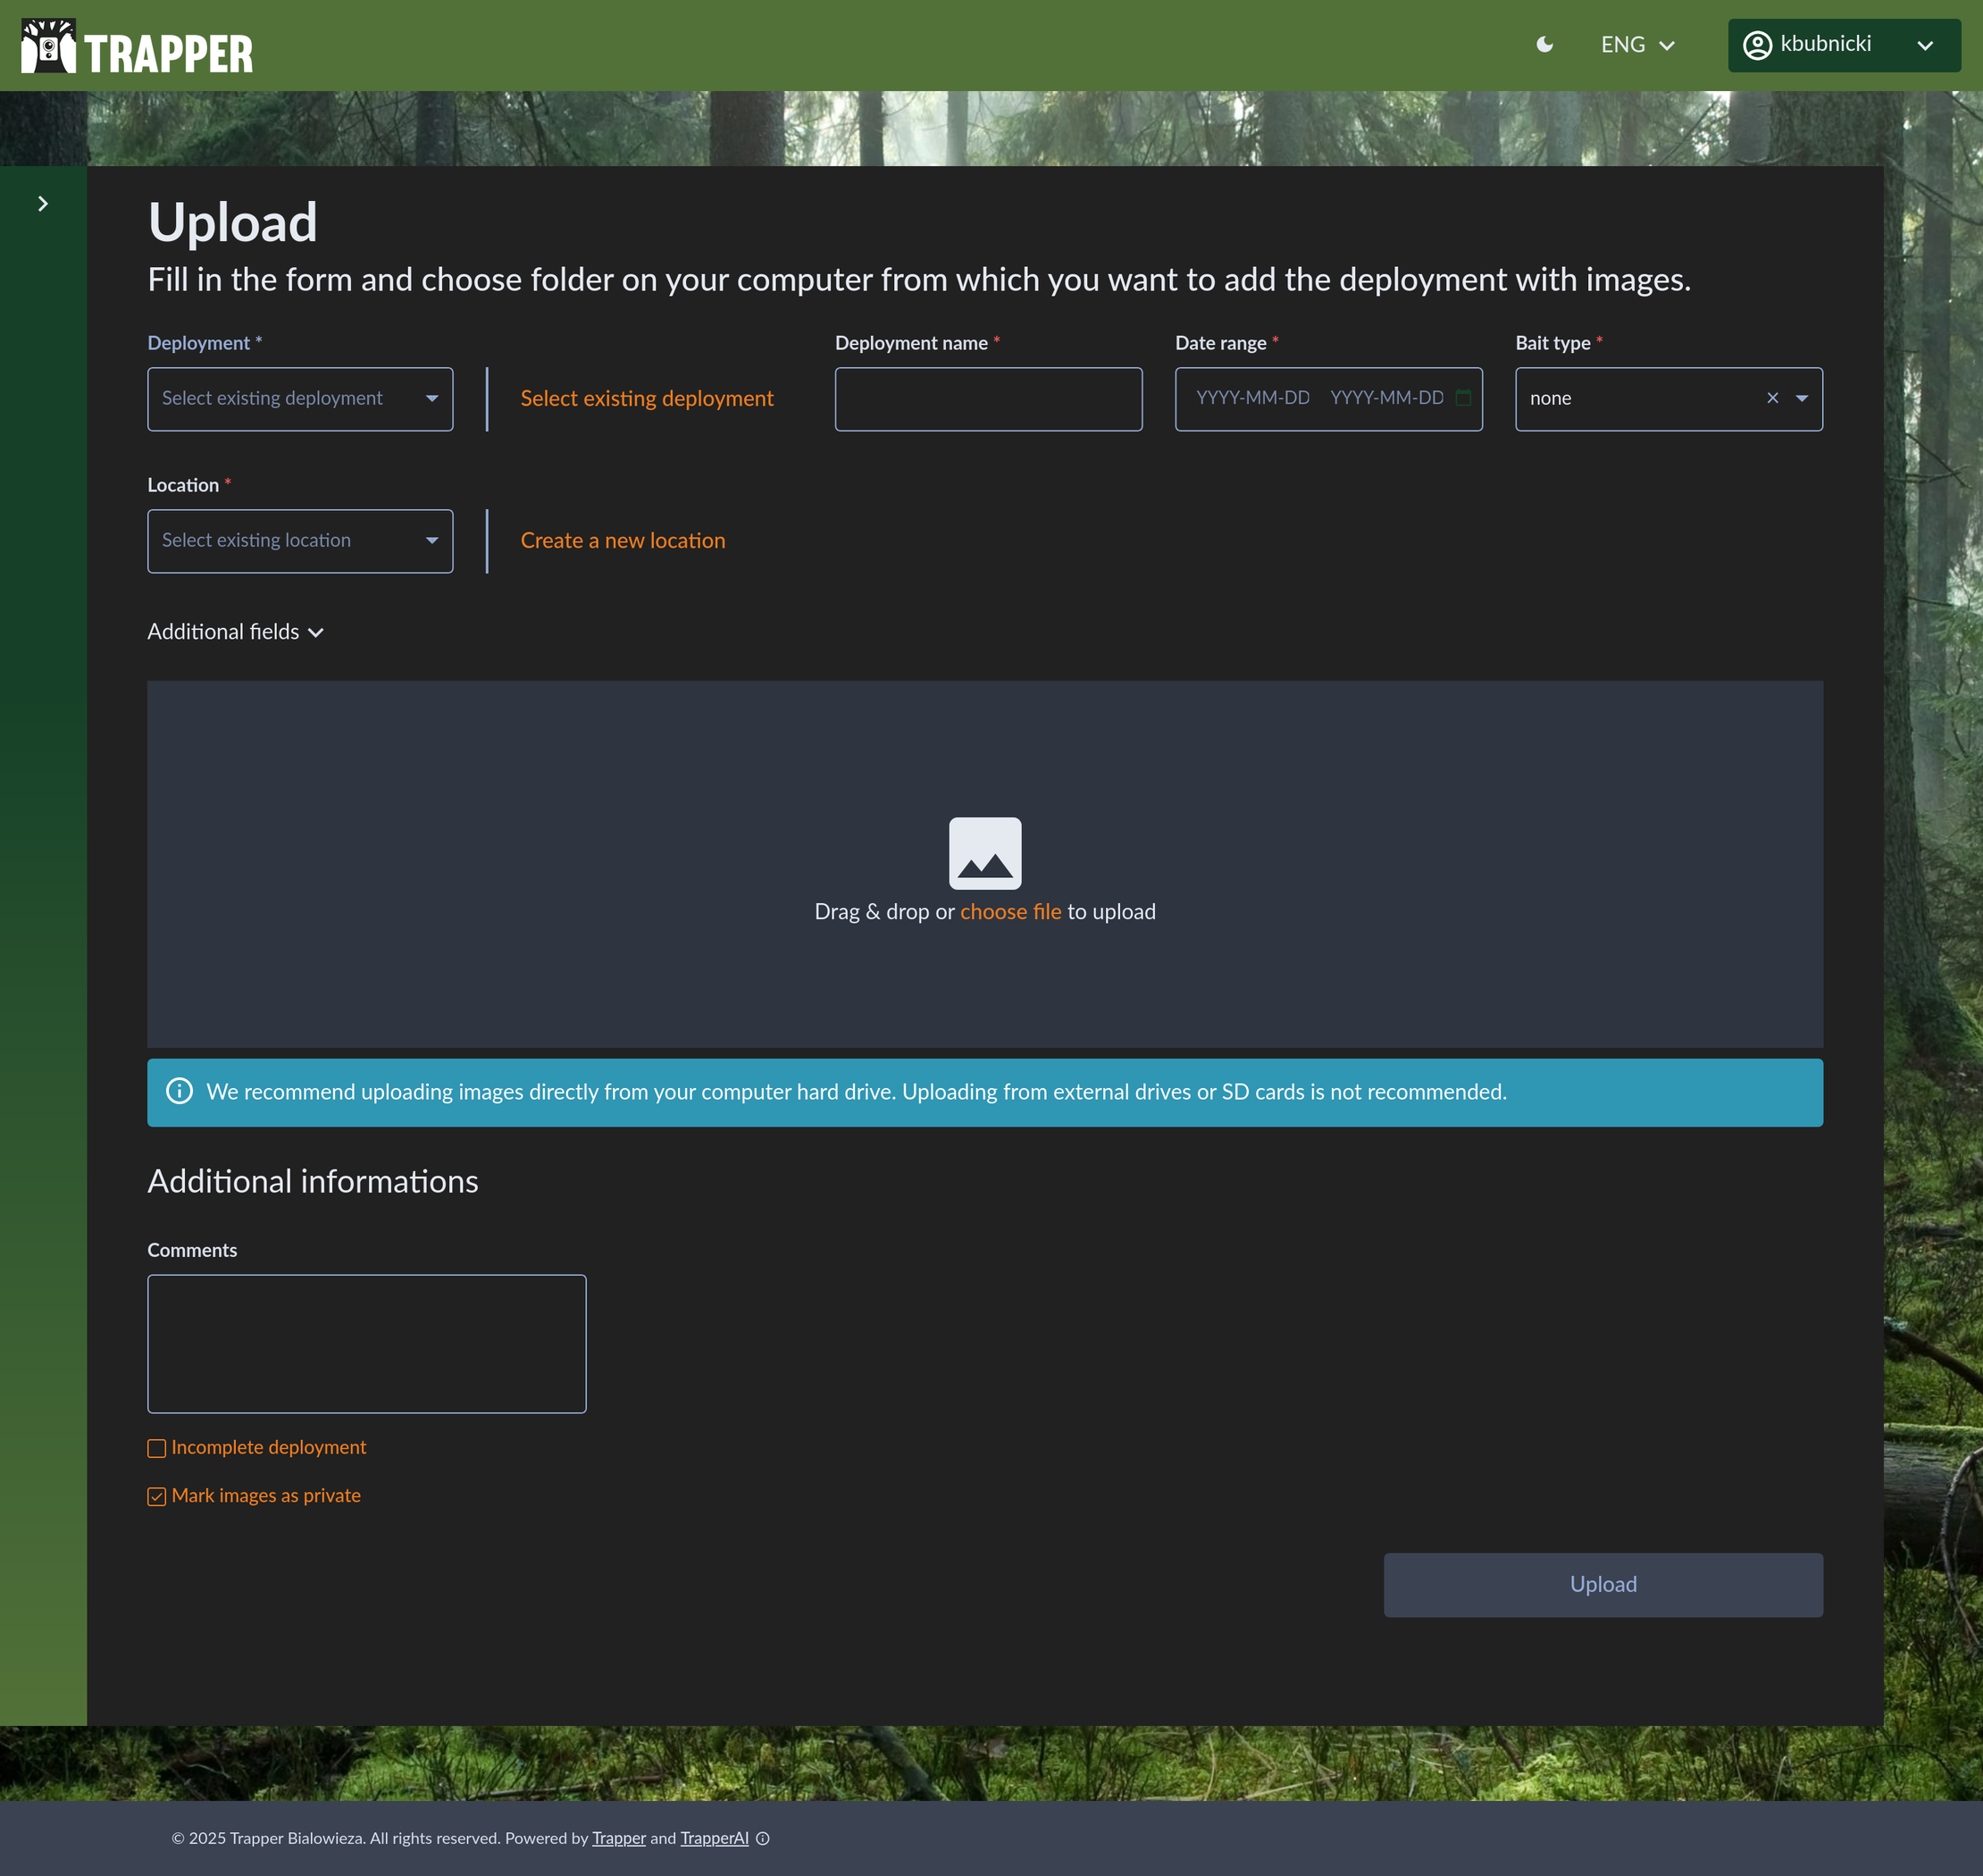
Step 2: Add Deployment Details
A deployment refers to a single session of a camera trap at a specific location.
Important
A deployment is the period during which a camera trap is installed at a given location and actively recording, typically without being moved or significantly altered. Ecologically, a deployment represents a continuous sampling event, capturing all wildlife activity within the camera’s detection zone for the defined time span. Each deployment is uniquely identified by its combination of location, time interval, and camera setup, and is fundamental for linking collected media and metadata to ecological analyses such as species occurrence, activity patterns, and habitat use. Read more
Deployment name: Give your deployment a unique and descriptive name (e.g.,
bialowieza_lcm_2025).Date range: Click the date field to open a calendar and select the start and end dates of the deployment. For this example, you might select August 1st to September 23rd, 2025.
Bait type: Specify if any bait was used. For most scientific studies, this will be none.
Defining the basic information for your deployment.
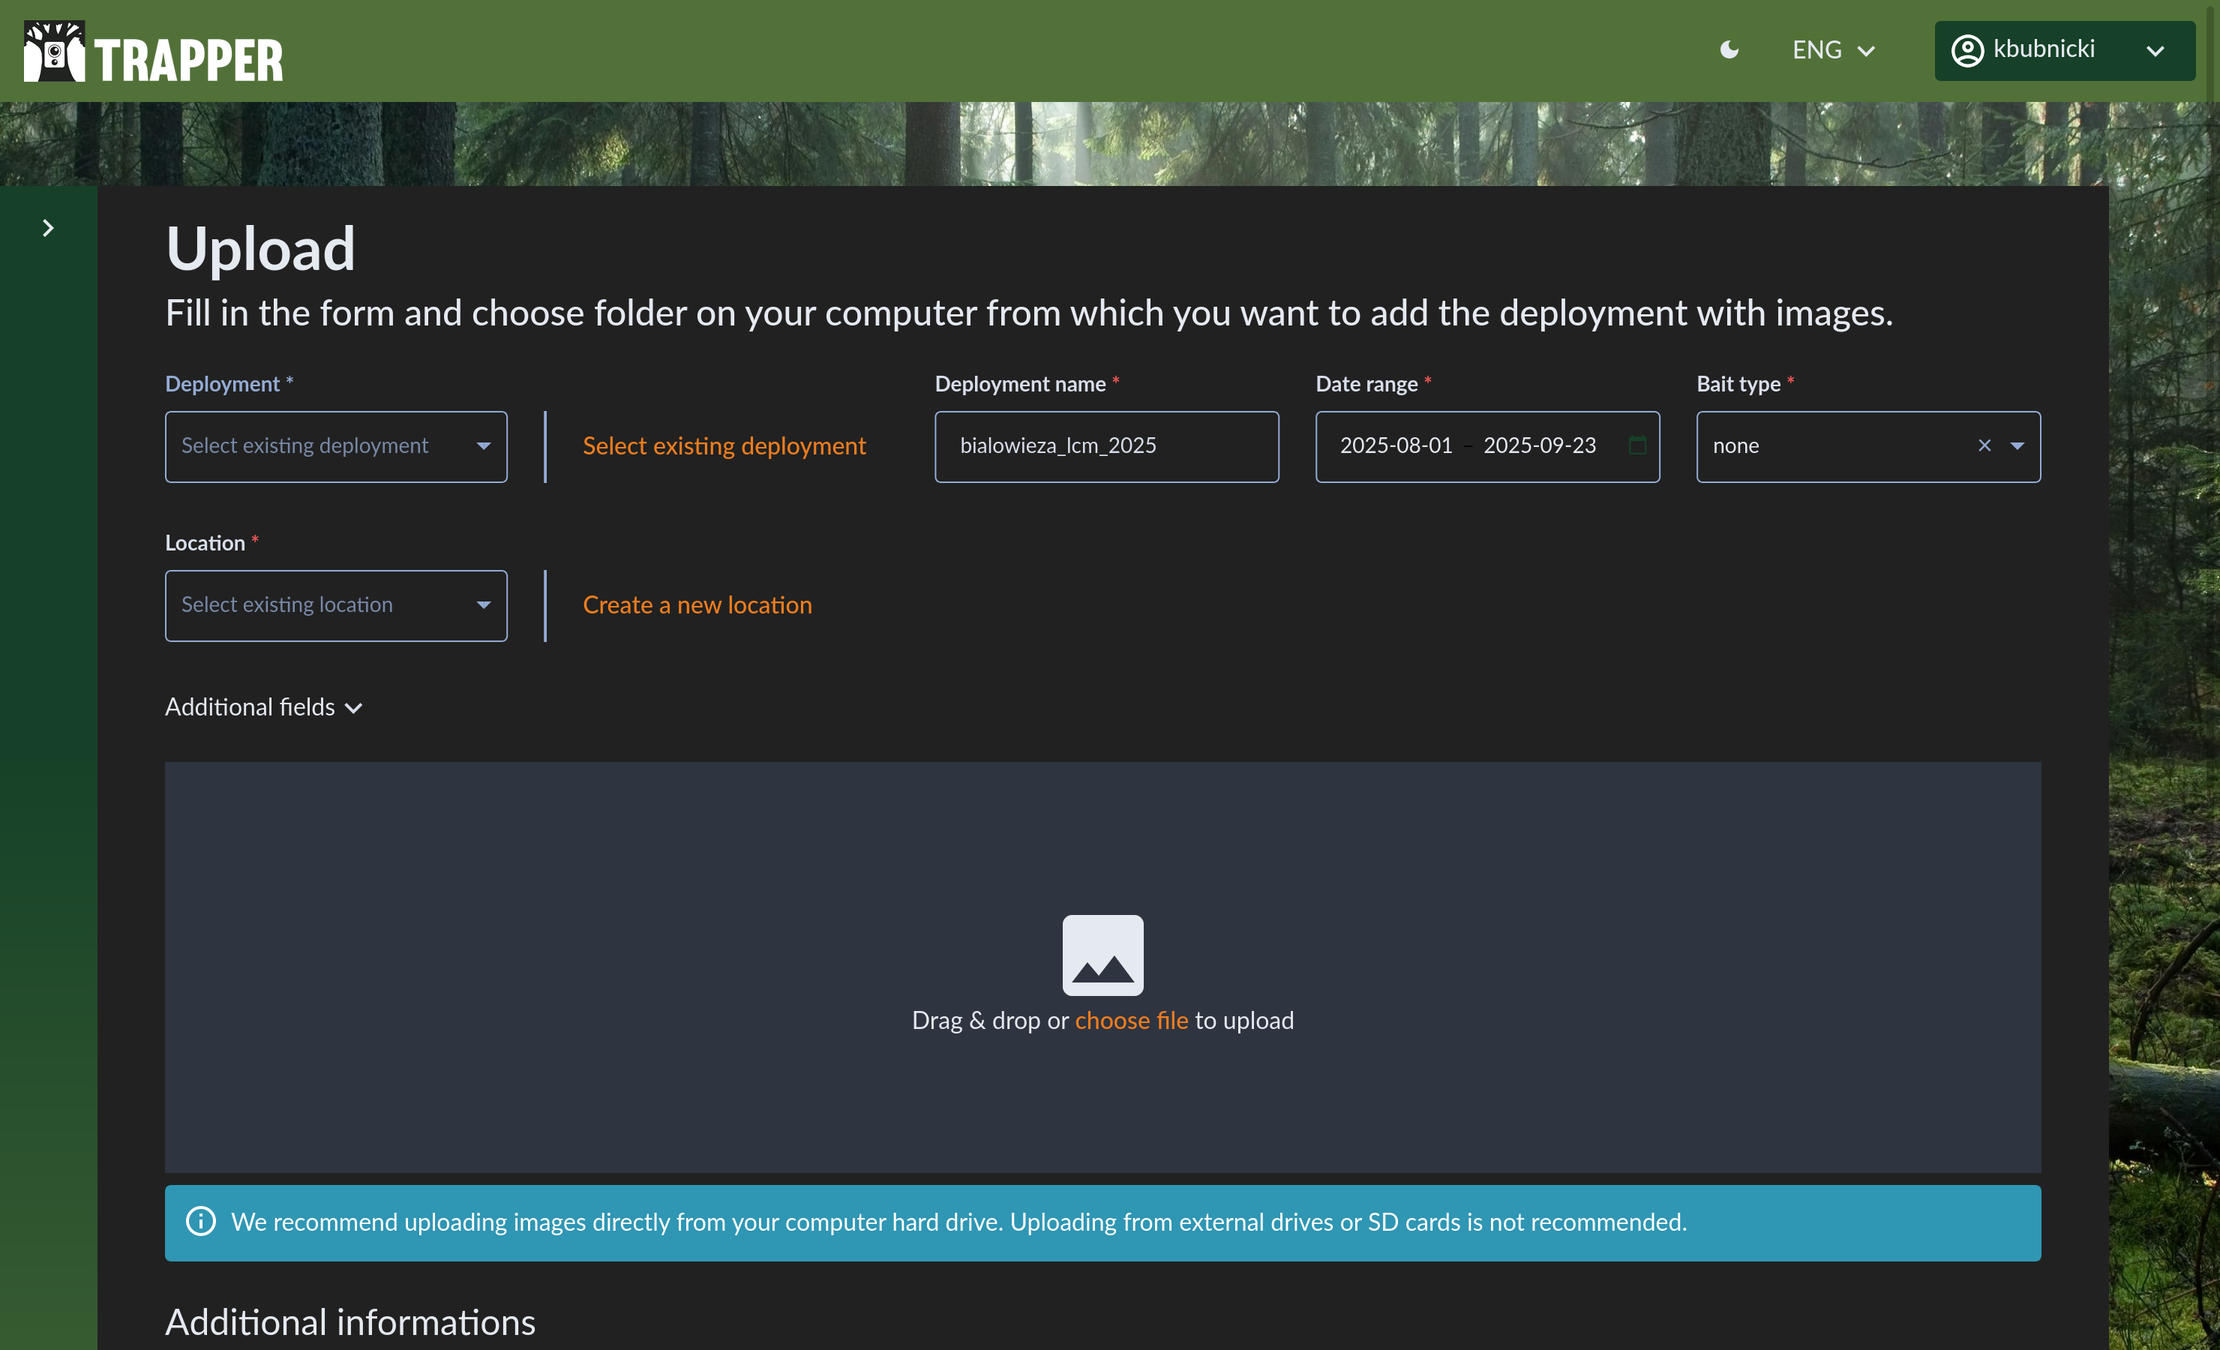
Step 3: Set the Location
Accurate location data is crucial. You can either select an existing location or create a new one.
Click Create a new location.
Location name: Enter a name for the new camera trap site (e.g.,
bialowieza_loc1).Set Coordinates: Click on the map to place a pin at the exact location of your camera. You can see the map of the Białowieża Forest area and zoom in for greater precision. The latitude and longitude will be filled in automatically.
Pinpointing your camera’s location for accurate spatial analysis.
Note
By default, the Deployment name (code) is combined with the Location name to create a unique deployment identifier in the following format:
{deployment_name}-{project_id}-{user_id}-{location_name}.
Custom deployment names and IDs can be provided via the Expert module - either by creating deployments manually or by importing a CSV file in the Camtrap DP format (see the tutorial section 4. Add deployments to TRAPPER). The only requirement is that each deployment ID be unique within its project. Deployments added in this way will then be available in the upload form for users who have the appropriate permissions to select and use them.
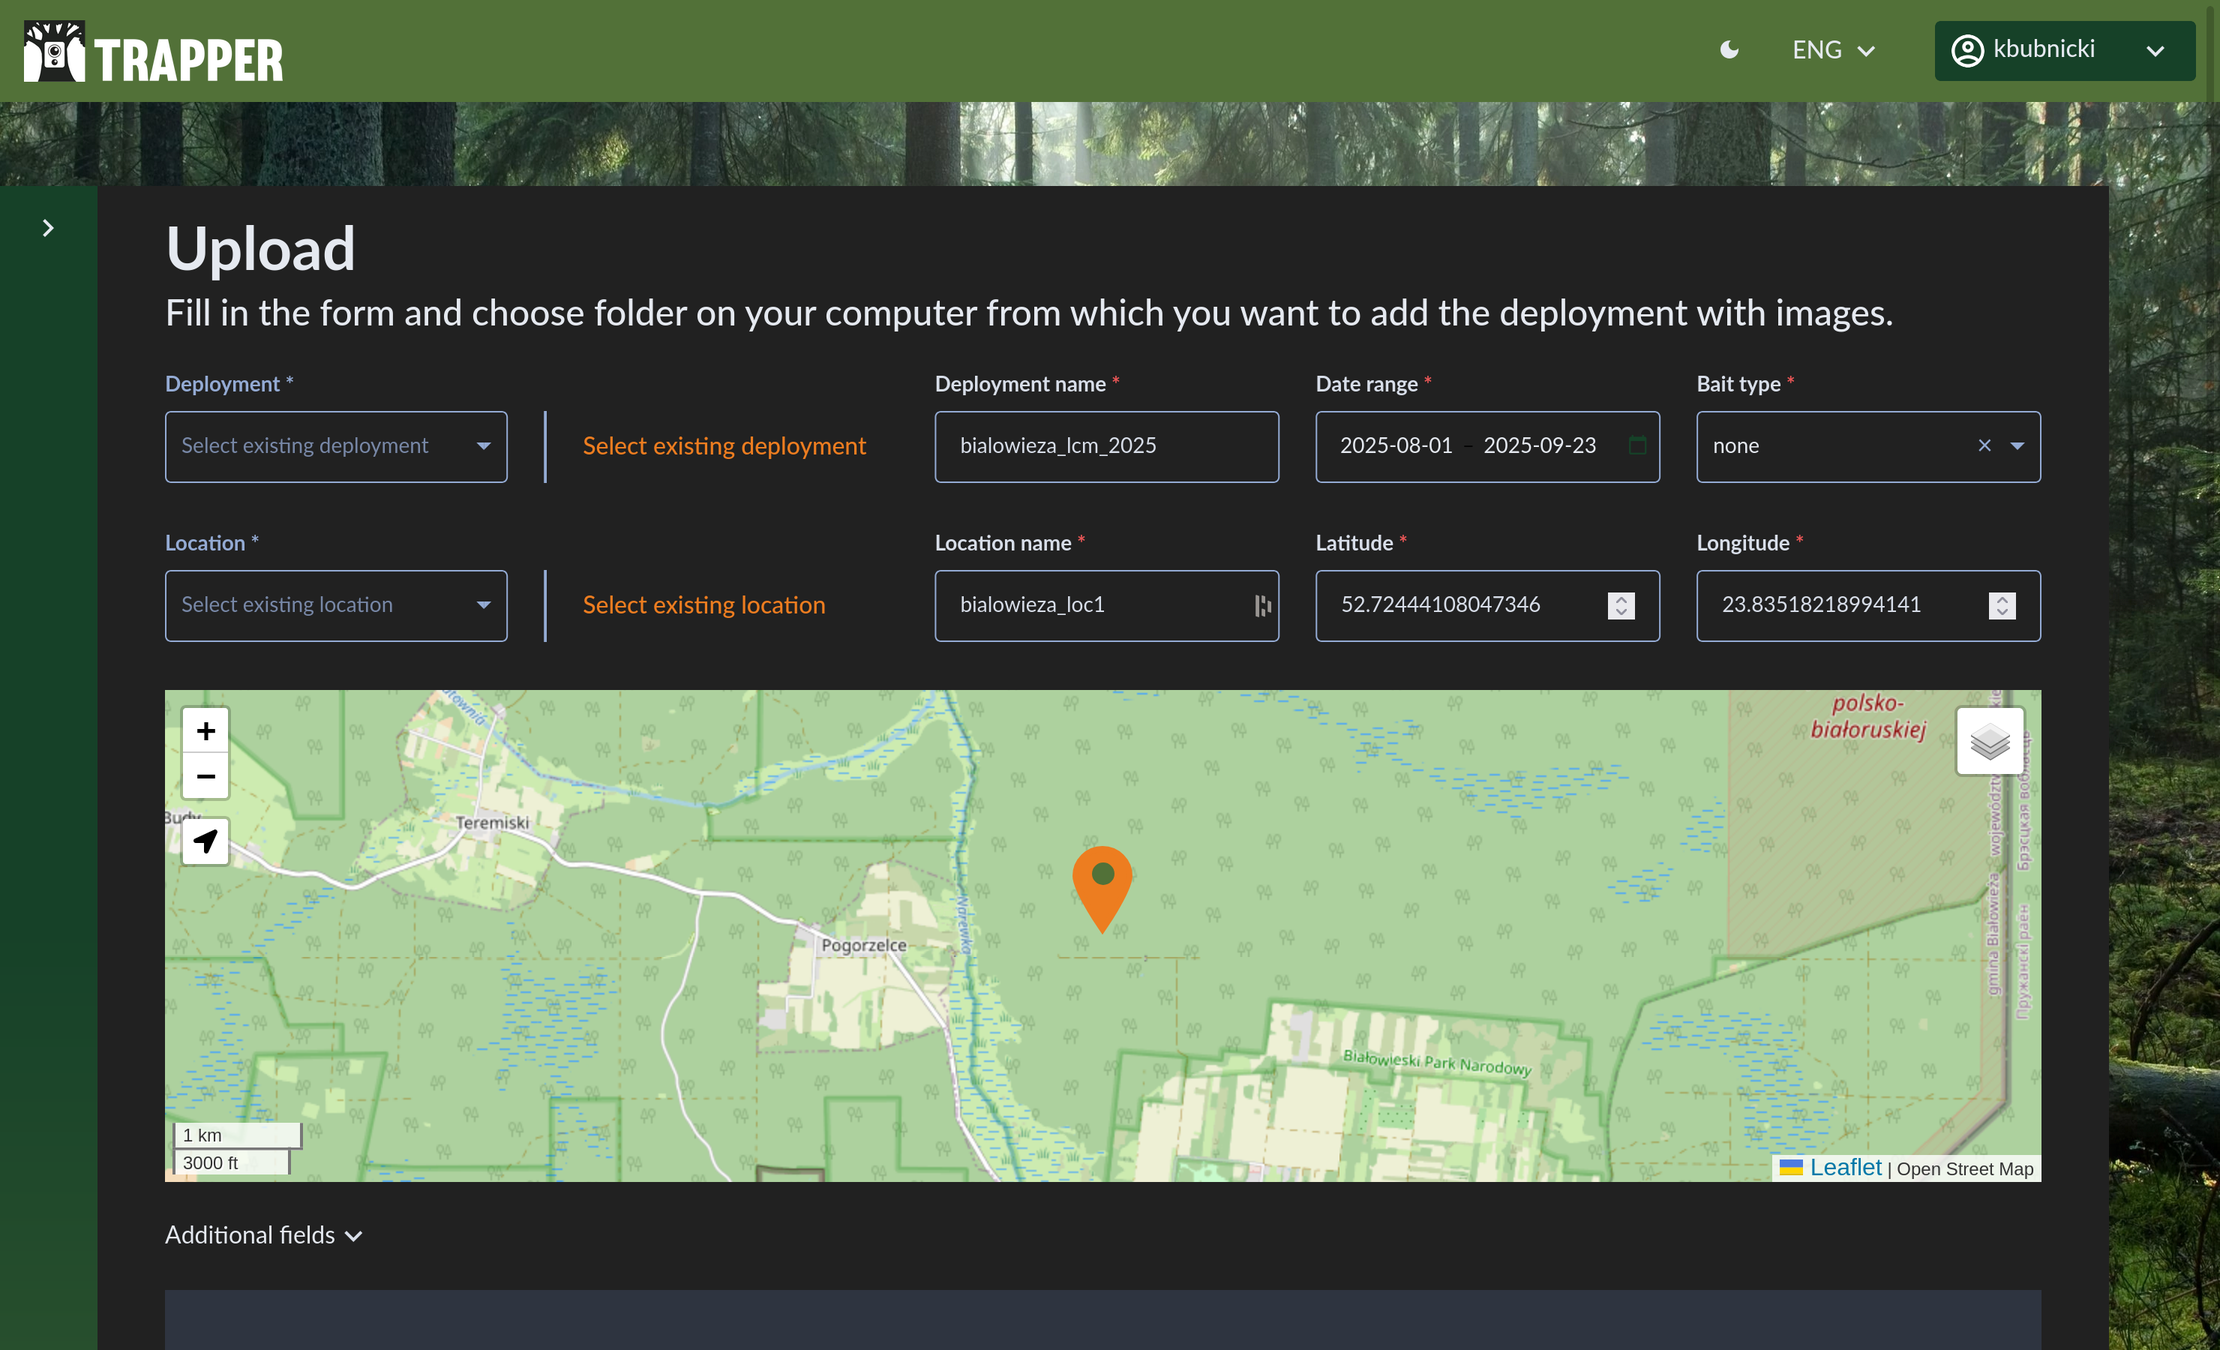
Step 4: Enter Camera and Additional Metadata (Optional but Recommended)
While optional, providing detailed metadata enriches your data and makes it far more valuable for scientific analysis. More data is always better!
Here are some of the key fields you can fill in:
Camera model: Enter the make and model of your camera (e.g.,
browning_btc6).Camera ID: A unique identifier for the physical camera unit (e.g.,
camera1). This helps track specific devices.Camera interval: The delay between triggered events in seconds (e.g.,
0).Camera height: The height of the camera from the ground in meters (e.g.,
1.2).Camera tilt: The vertical angle of the camera. Use
0for parallel to the ground, or a positive/negative value for angled down/up (e.g., “-10” for a slight downward tilt).Camera heading: The compass direction the camera is facing (e.g.,
270for West).Detection distance: The estimated effective range of the camera’s sensor in meters (e.g.,
20m).Feature type: The type of feature the camera is monitoring (e.g.,
Road dirt,Water source,Carcass).Habitat: A description of the habitat type (e.g.,
mixed forest,riparian zone).Timestamp issues: Check this box if you know there was a problem with the camera’s clock.
Comments: A free-text field at the bottom of the page for any other relevant notes. This is the perfect place for observations like “Camera was knocked by a boar on Sept 15th” or “Battery change performed on Sept 10th.”
Adding rich metadata makes your data more robust and useful for analysis.
Important
Data Standardization: All the deployment metadata fields in Trapper, from camera settings to location data, are fully compatible with the Camera Trap Data Package (Camtrap DP) standard. This ensures that your data is structured, interoperable, and ready for sharing with global biodiversity platforms. You can learn more at the official Camtrap DP website: https://camtrap-dp.tdwg.org/
Step 5: Upload Your Files
Now it’s time to add your media!
Click the Drag & drop or choose file to upload area.
Navigate to the folder on your computer containing your images or videos.
Select all the files you want to upload and confirm. You can select multiple files at once.
A progress bar will appear showing the status of your upload. Wait for it to complete.
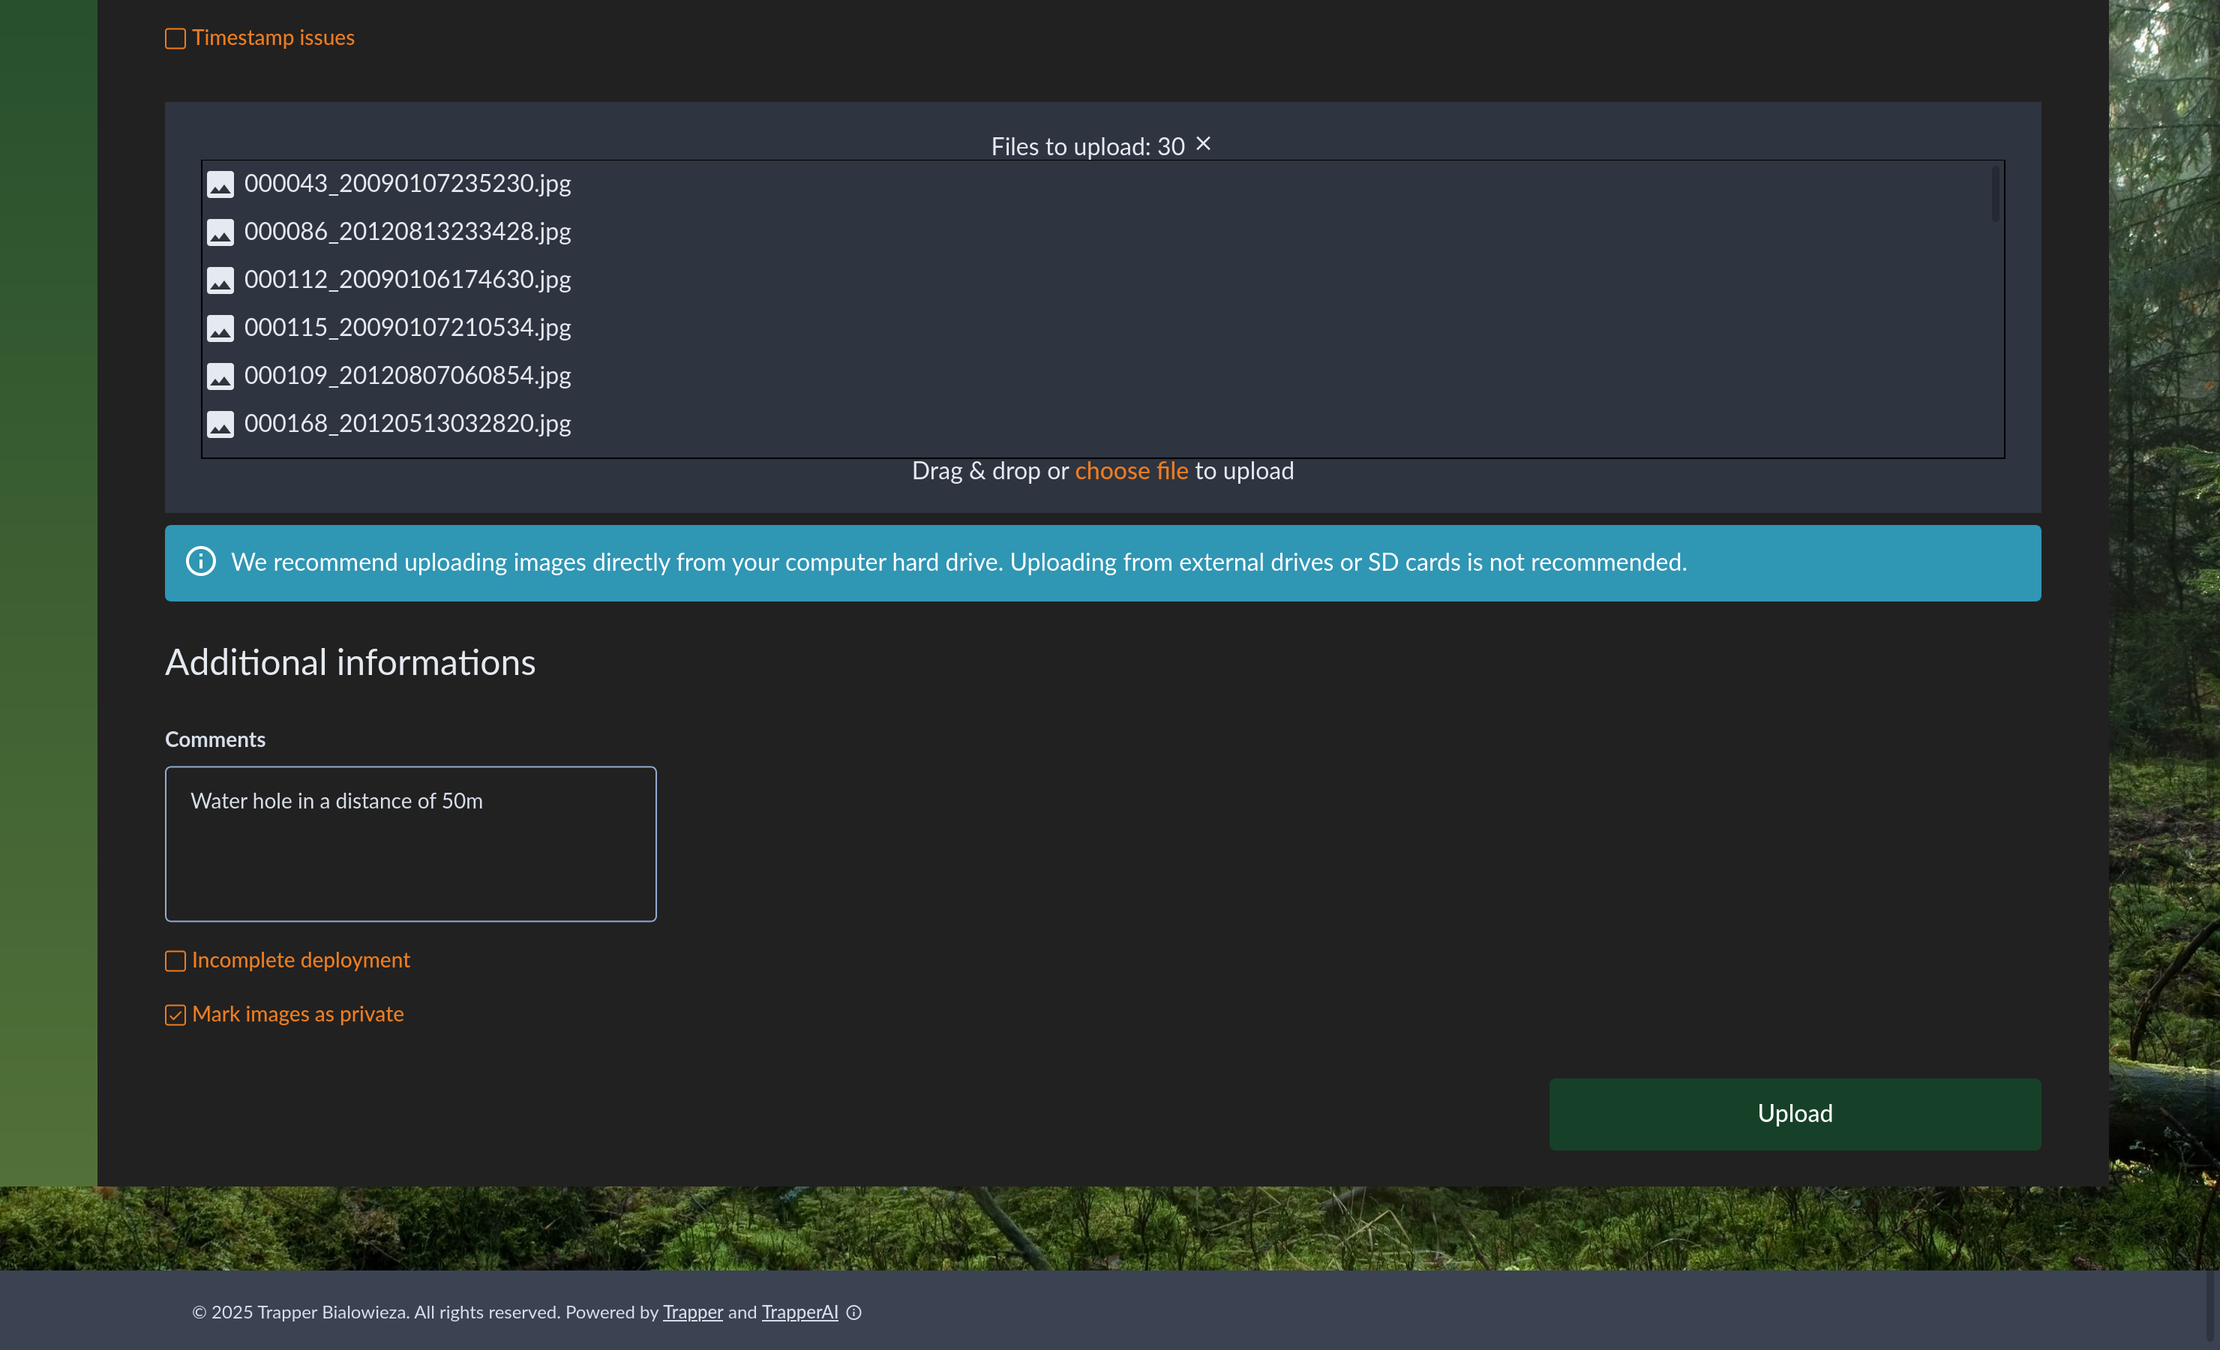
Choosing the images and videos for your deployment.
Note
Automatic AI Processing: Once your files are successfully uploaded, they automatically enter an AI data processing pipeline. This pipeline, which may include object detection and species identification models, is configured in the project’s Classification Project settings. For more details on configuring this pipeline, please see the Classification Project AI Configuration. To learn more about the automatic pipeline workflow see the Automatic AI Pipeline Workflow.
Viewing Your Data
Deployment Summary
Once the upload and initial processing finish, you will be redirected to the Deployment Summary page. There you can view:
A data panel displaying all entered metadata, including the deployment ID, location, coordinates, date range, and deployment owner.
A gallery of the images you uploaded. The system will display “Classification in progress…” while the AI analyzes your media.
An interactive map showing the deployment location; you can zoom in and out to examine it in greater detail.
Additional information, such as extra metadata fields, comments, and options to mark images as private or to flag an incomplete deployment.
Statistics about the processed data, including resources processed by object detection and species models, resources you classified, and resources classified by other experts.
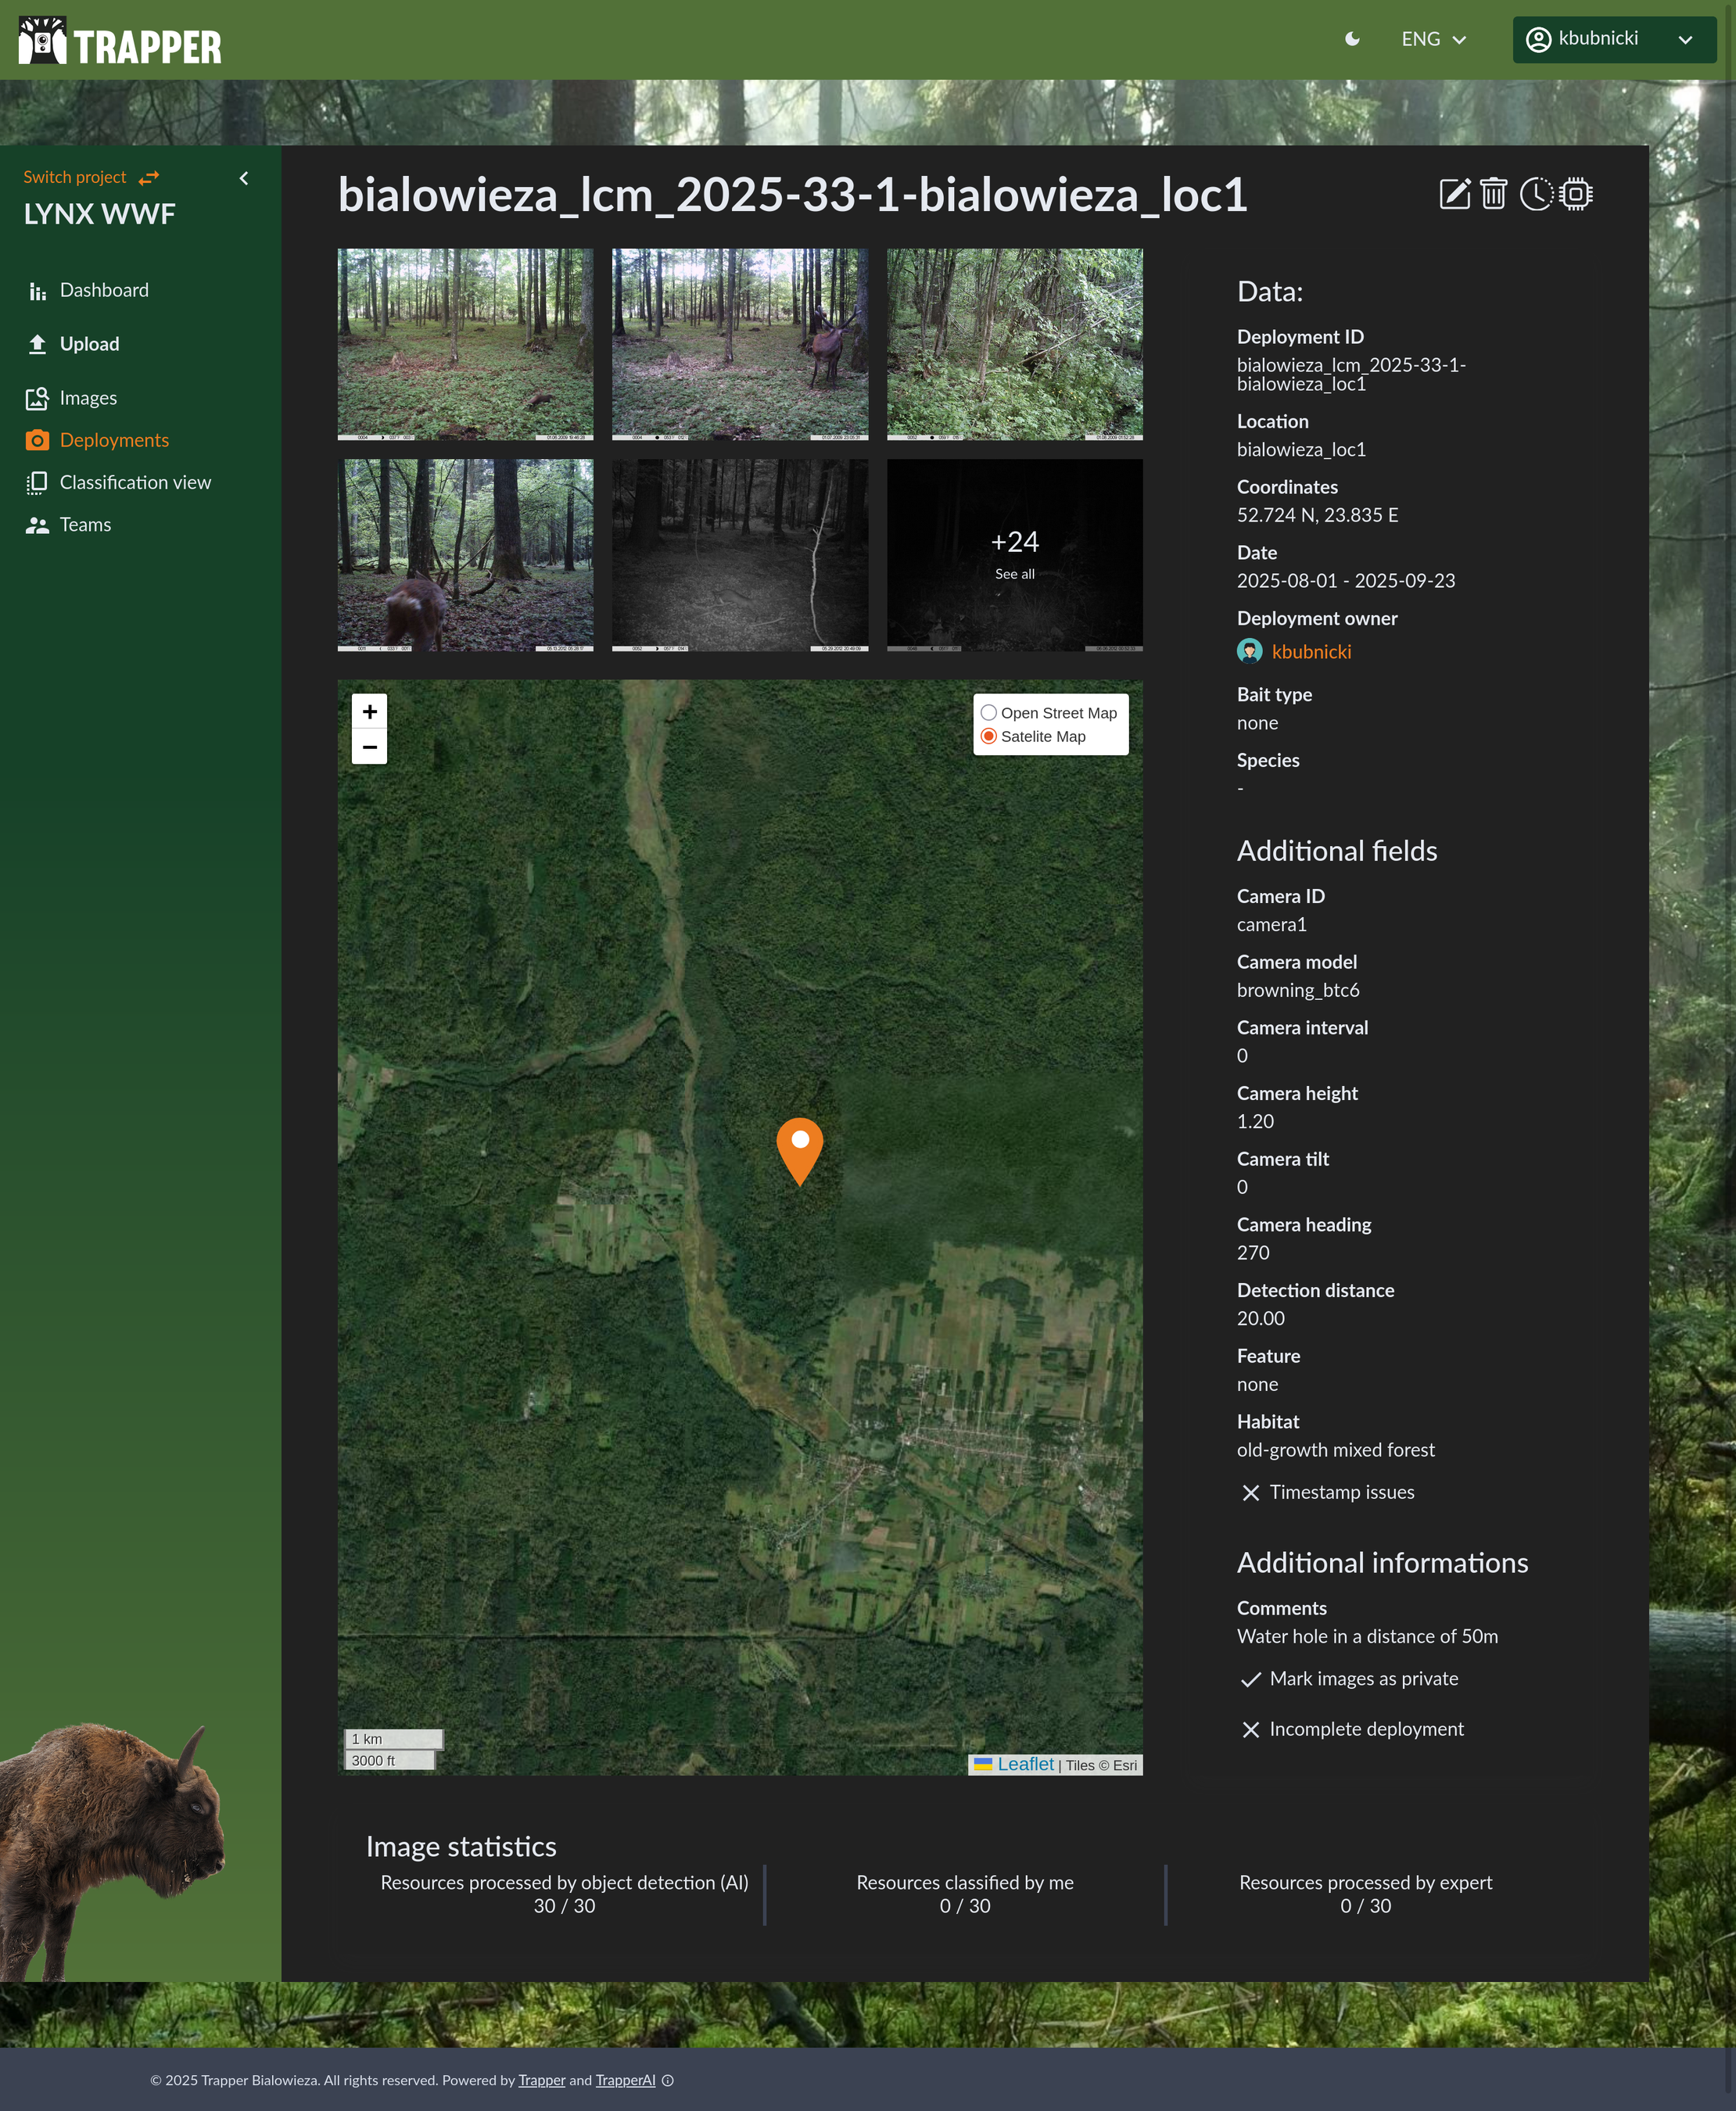
A complete overview of your newly created deployment.
The Images / Media View
The Images tab (or Media, when working with both images and videos) lets you browse and filter all media files available in this project. Each row represents a single media file and its associated observations (no detections, animals, humans, or vehicles).
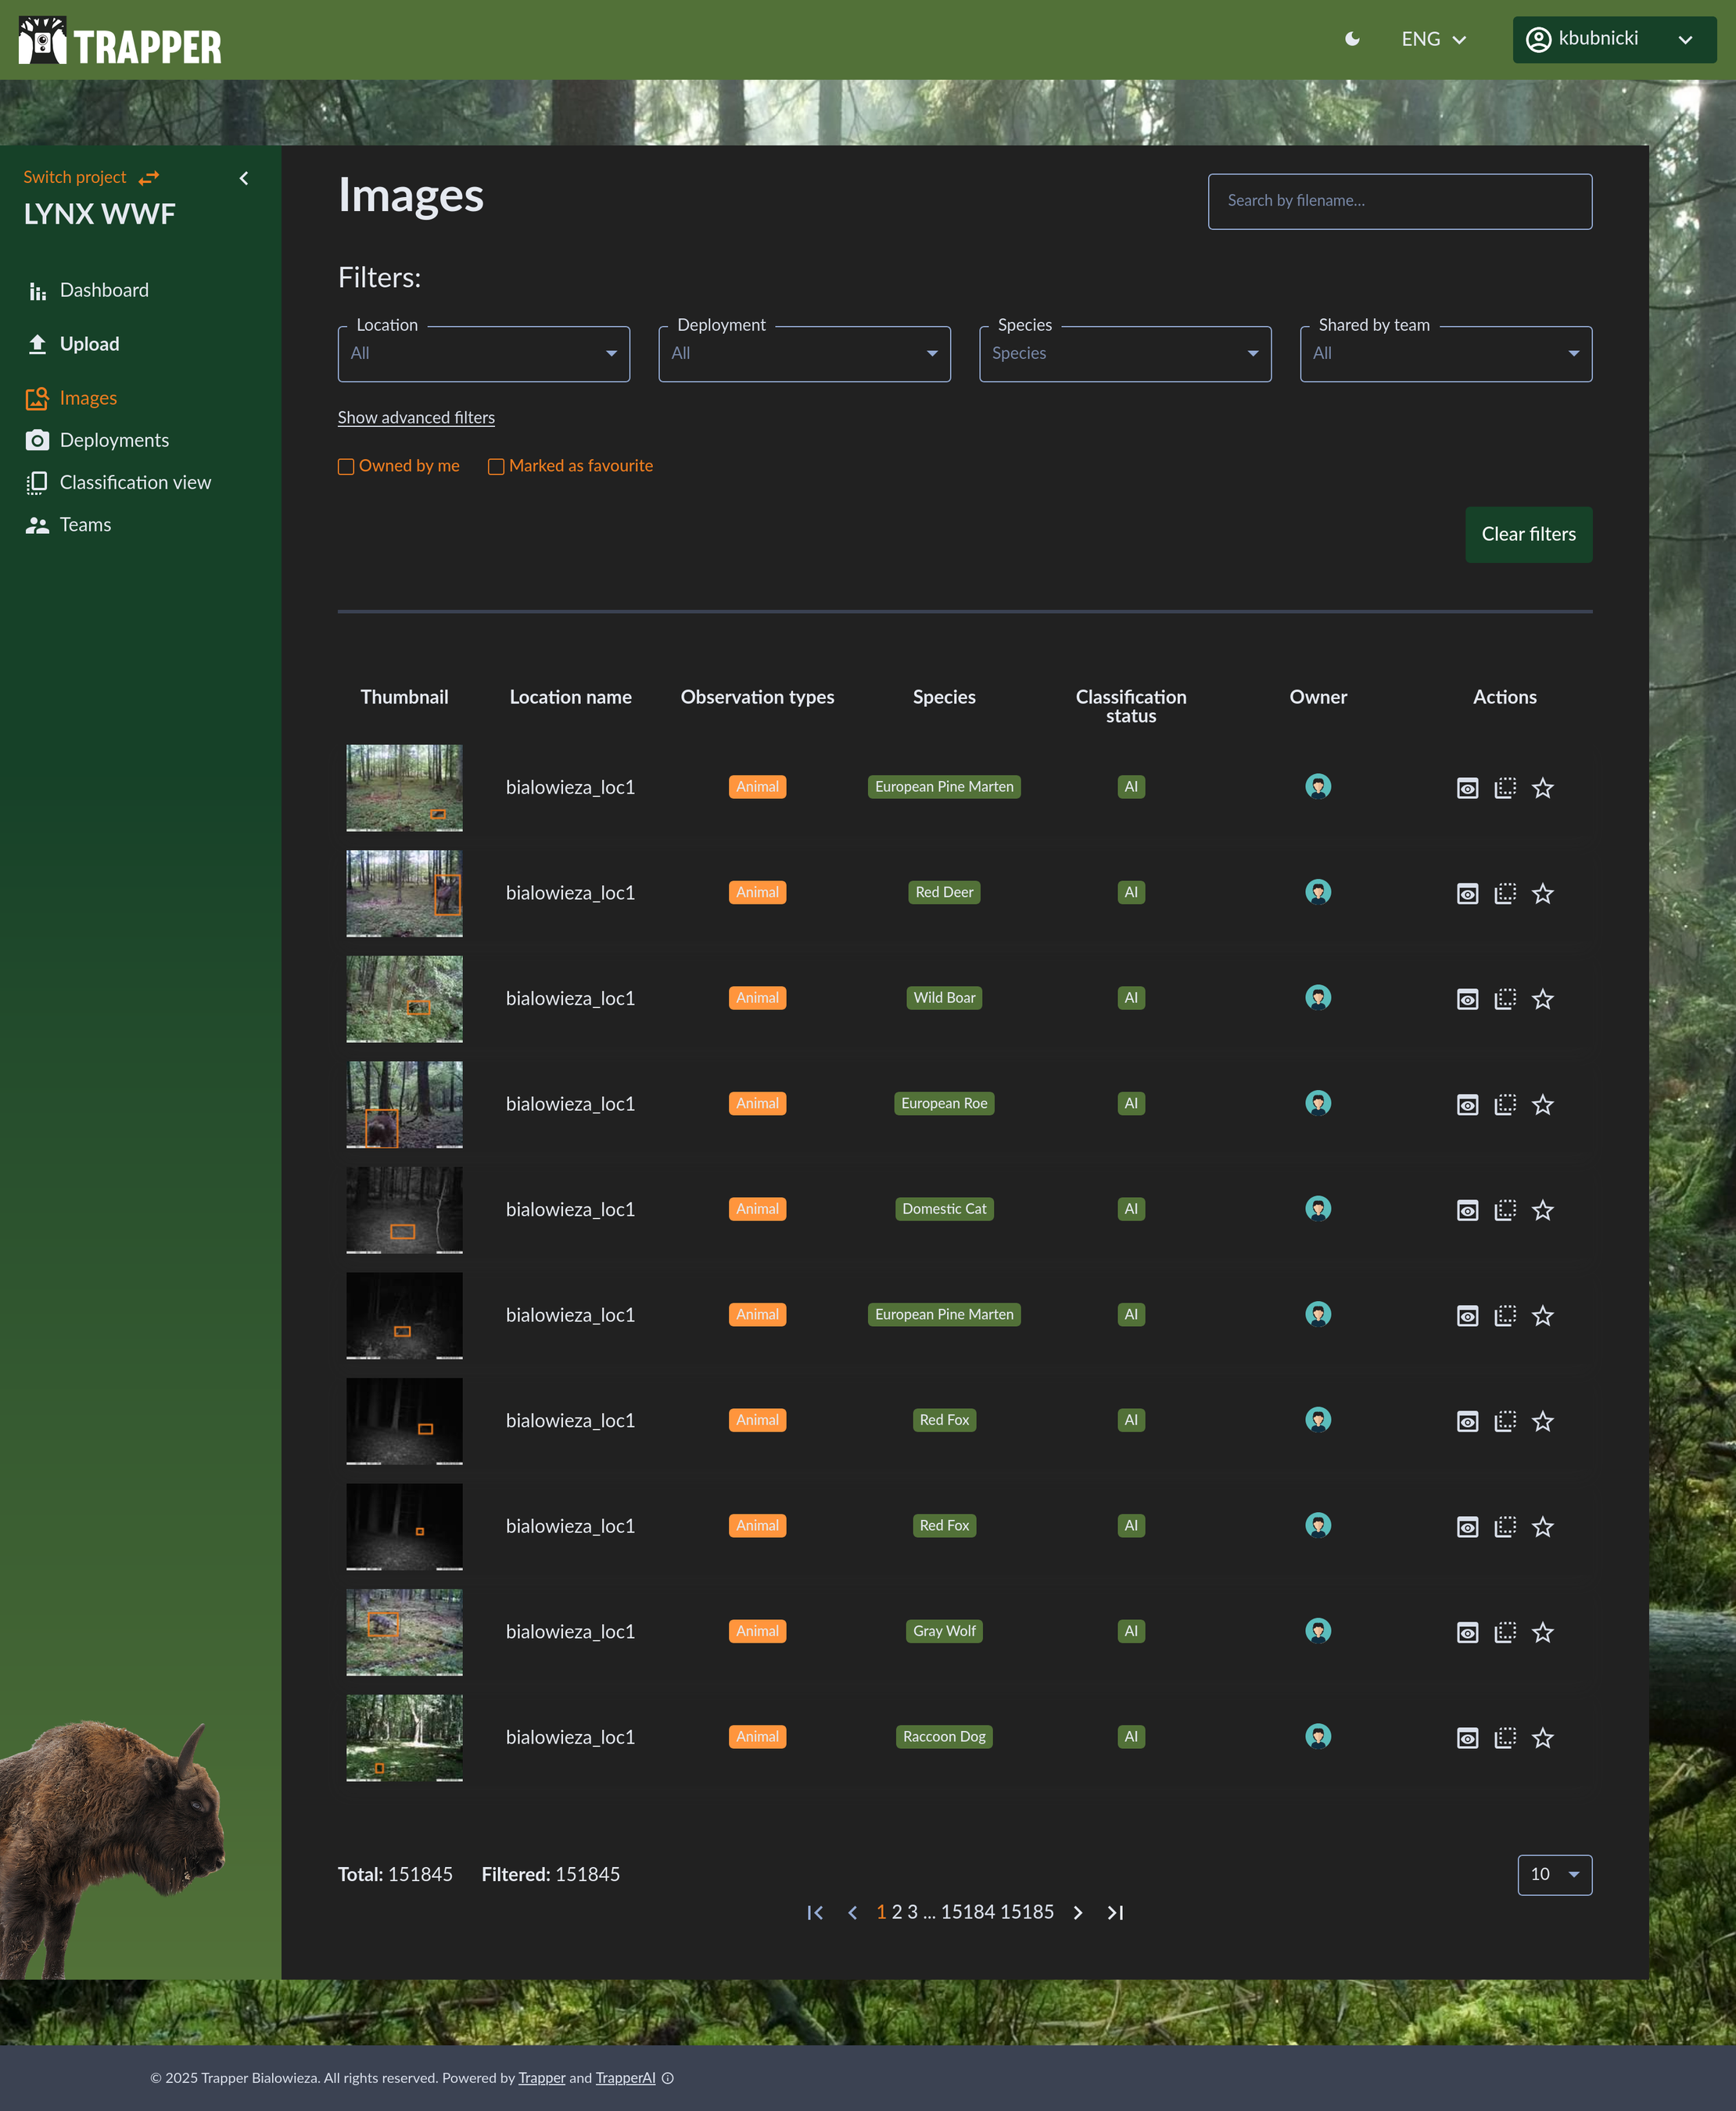
Browse every animal detection identified by the AI.
You can use the advanced filters at the top to narrow down the results by Deployment, Species, Shared by team, Observation type (e.g., Animal, Human, Vehicle), Sex, Age, and Classified by me.
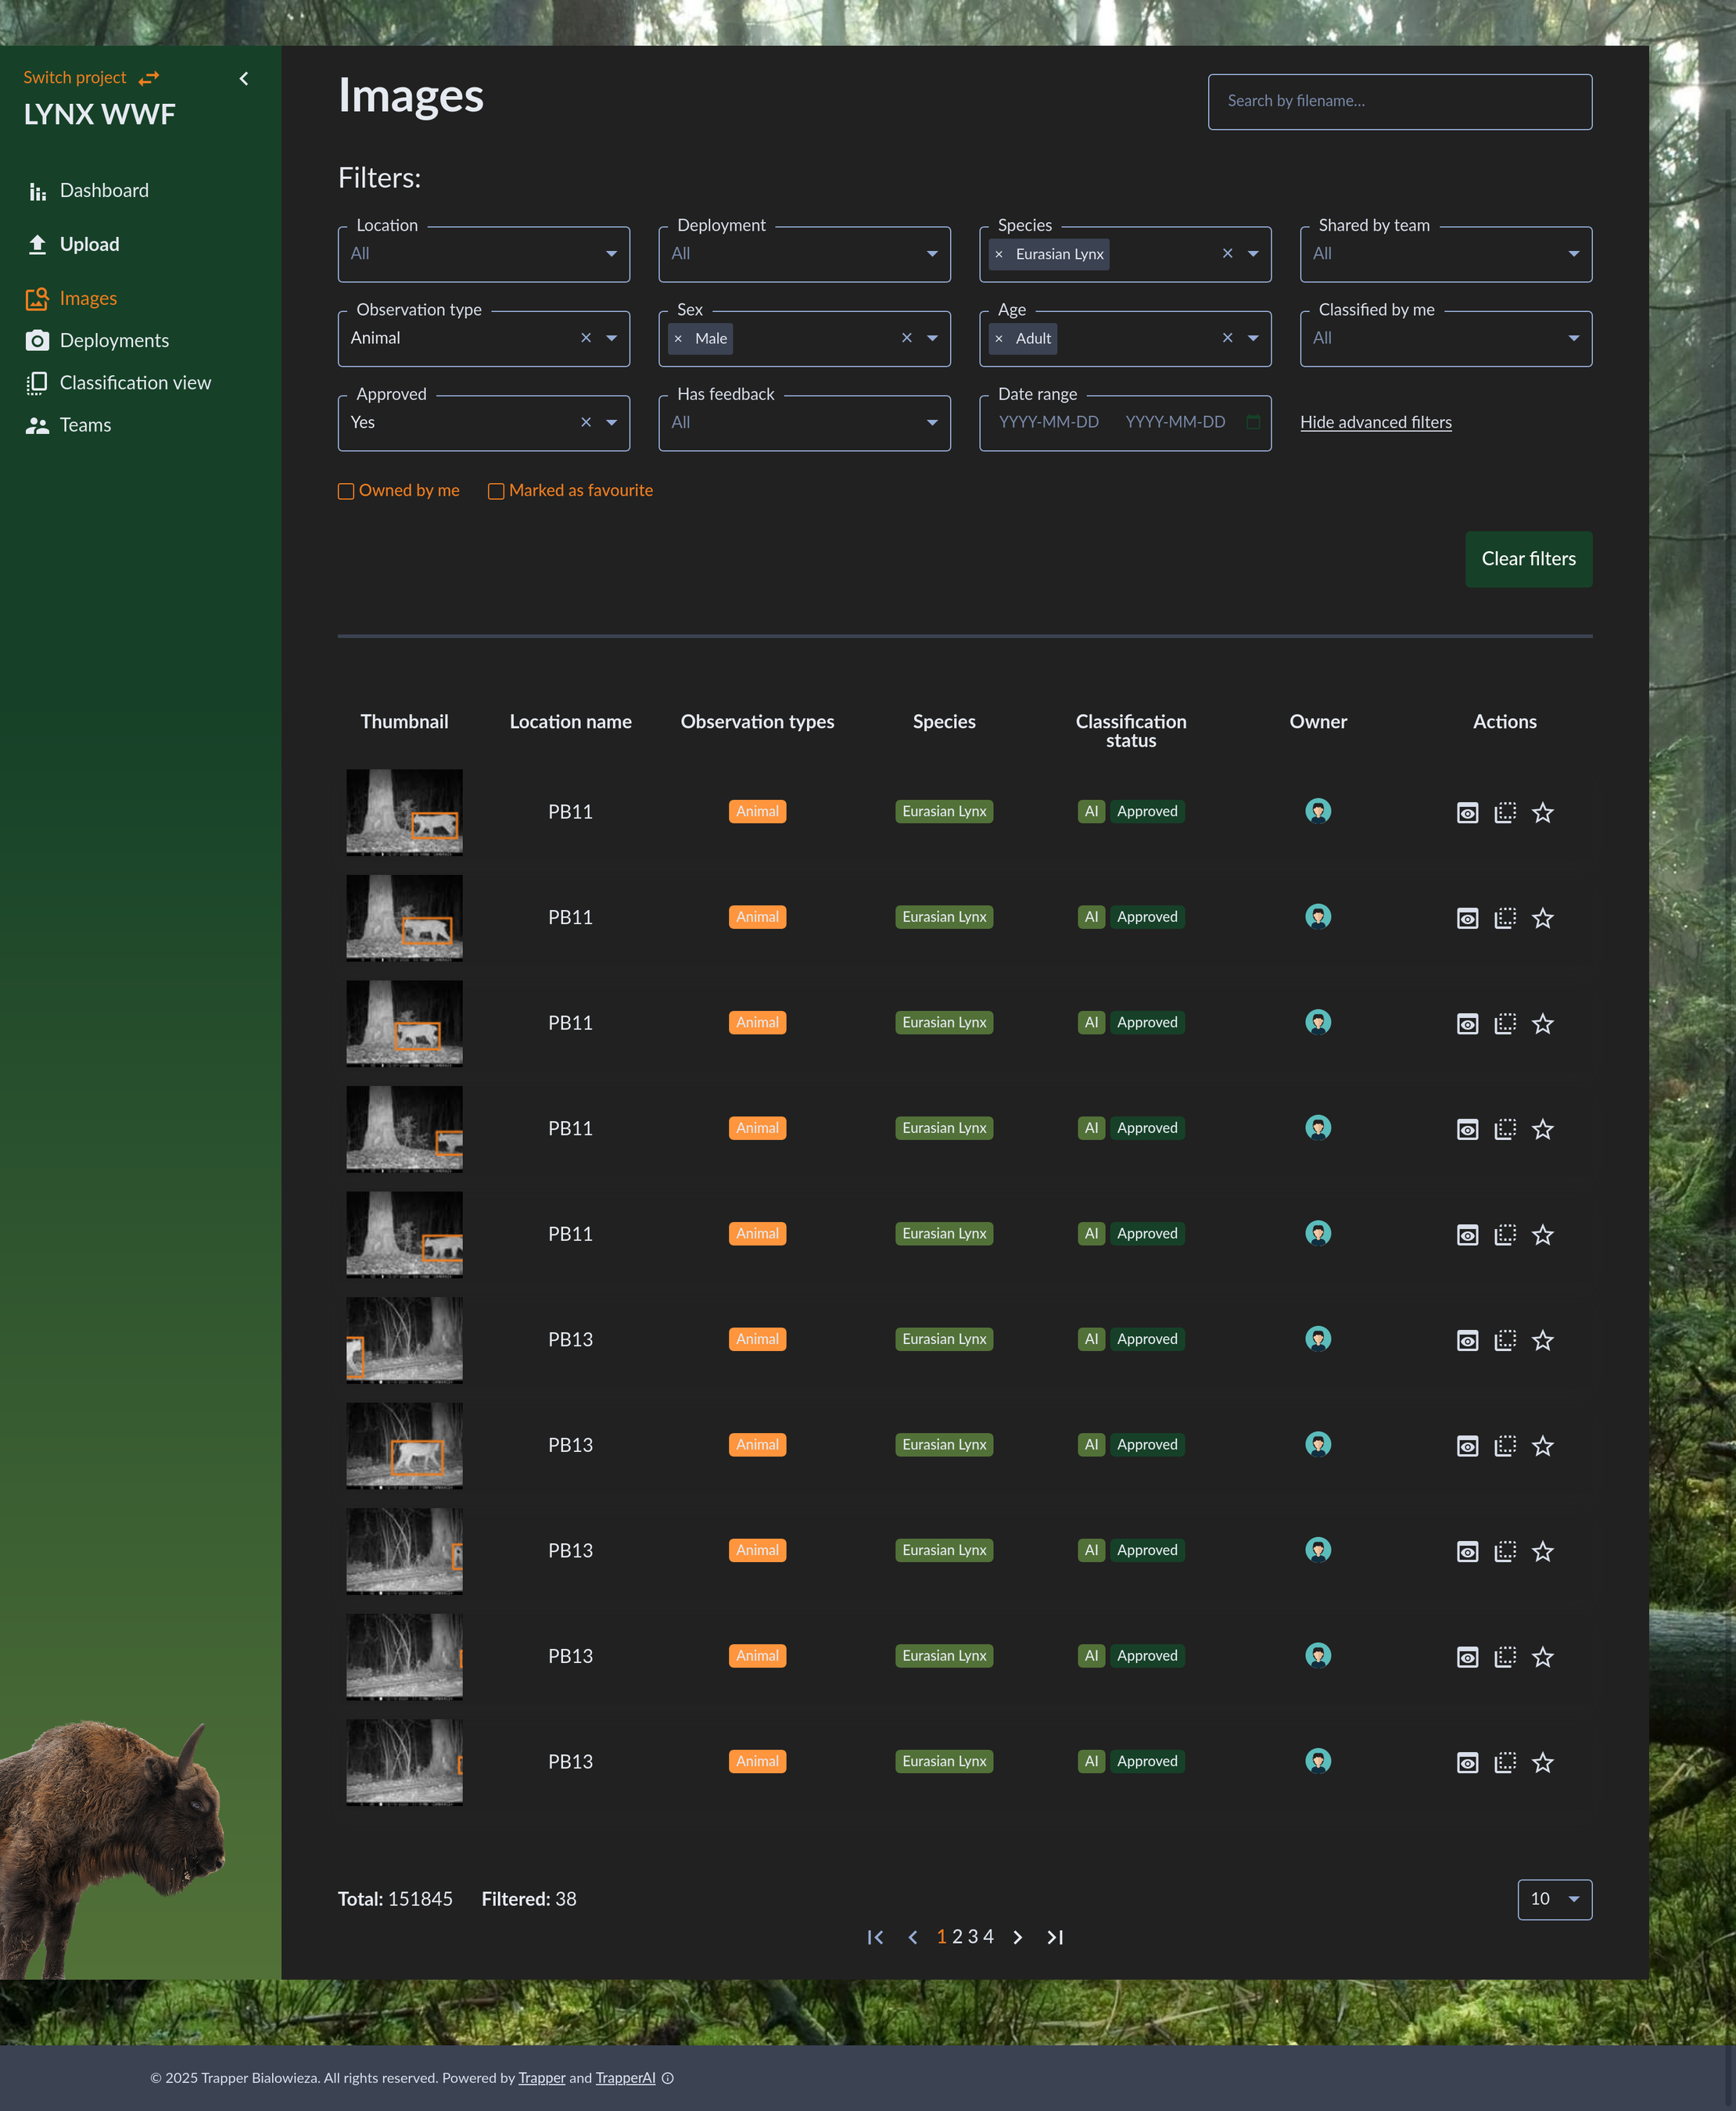
Quickly find the exact data you’re looking for.
The Image Viewer
Clicking on any observation in the list opens the Image Viewer. This powerful tool allows you to:
View the image with AI-generated bounding boxes and labels.
Zoom in and out for a closer look.
Adjust contrast, brightness, and saturation using the image filter tools to enhance visibility, especially in nighttime shots.
Easily navigate between other images in the same sequence using the thumbnails at the bottom.
View video files and play them directly in the viewer.
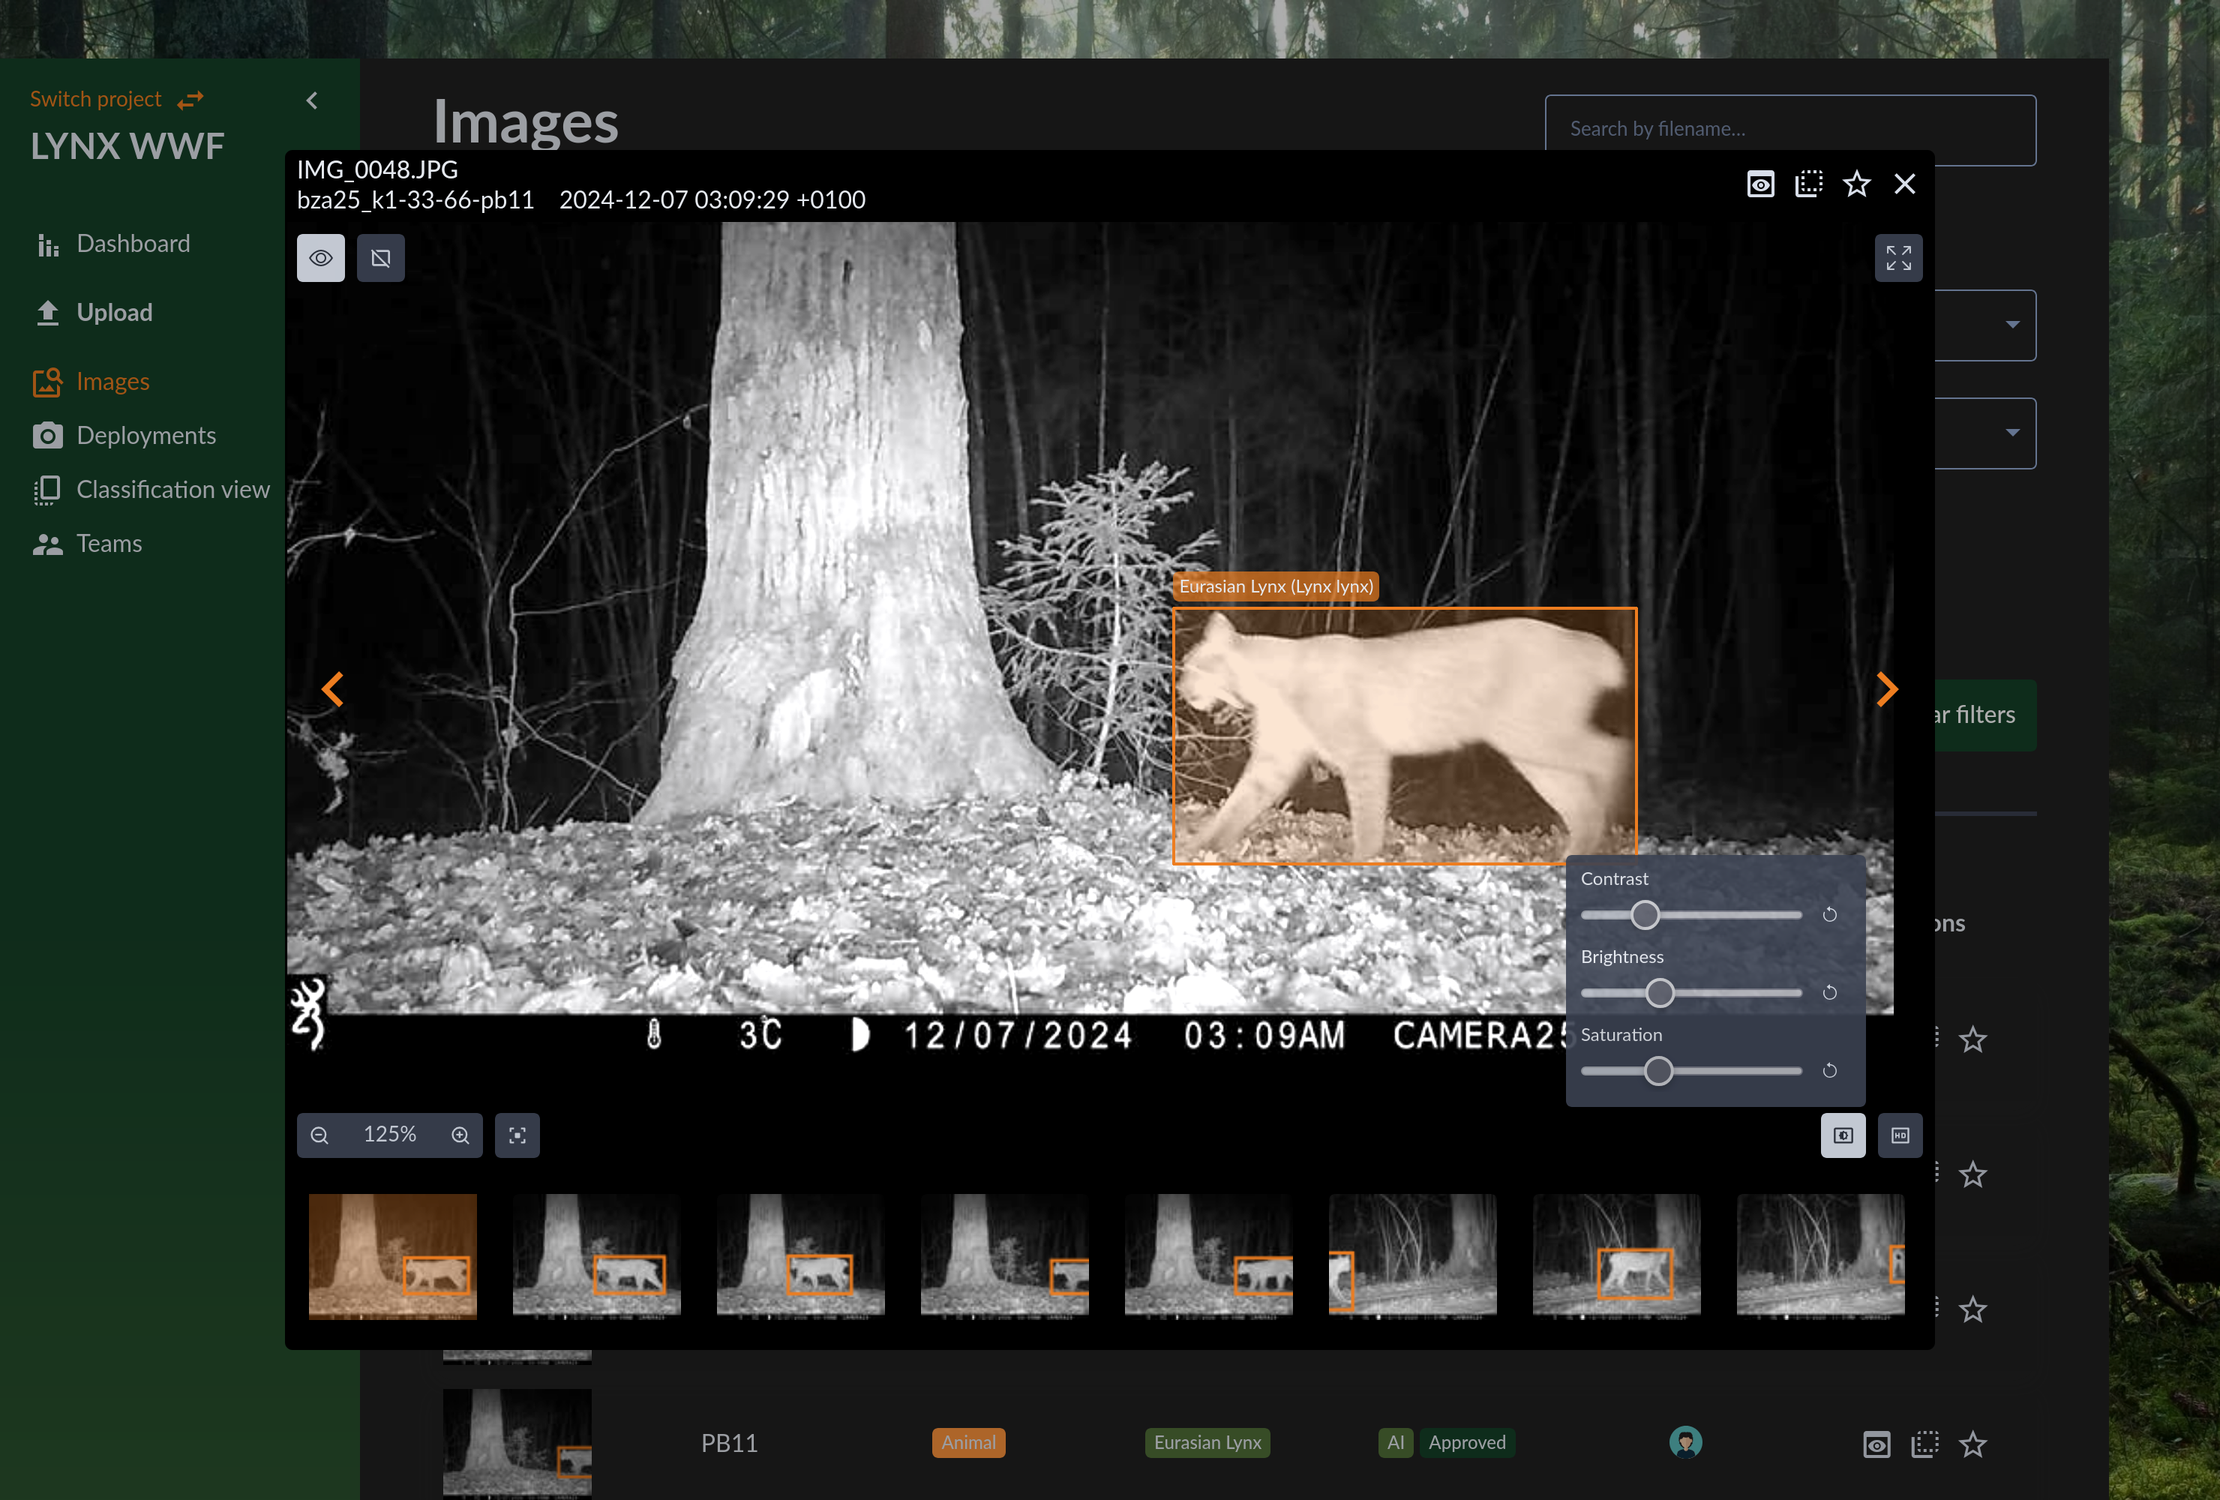
Inspect individual detections in detail.
The Classification Interface
The Classification module is where you, the expert, can review, correct, and validate the AI’s work. This is the heart of the platform, designed for both precision and efficiency.
Navigating Your Data
The interface organizes media into sequences.
Note
What is a sequence? A sequence is an ecological event. It’s a group of images or videos that captures a continuous event, like an animal or group of animals passing in front of the camera. The system automatically groups media into a sequence if they are captured within a specific time of each other (e.g., 5 minutes). This allows you to analyze a single event instead of many separate photos, which is crucial for tasks like counting unique individuals. Read more
The interface provides efficient navigation at multiple levels: single objects, individual media files, and whole ecological events (sequences).
Single-object navigation: jump directly between annotated objects (click a bounding box or use keyboard shortcuts) to inspect or edit individual detections.
Single-media navigation: move through images or videos using the next/previous controls or by selecting thumbnails in the sequence strip.
Event/sequence navigation: navigate entire ecological events via the sequence strip, select multiple frames for group actions, or jump directly to a specific sequence or resource by entering its ID.
The sequence strip at the top allows for efficient navigation through ecological events.
Important
Keyboard Shortcuts: To maximize your efficiency, the interface supports a variety of keyboard shortcuts for common actions like navigating between objects and images, zooming, and applying classifications. To see the available list of keyboard shortcuts, use the following keys: Ctrl + /
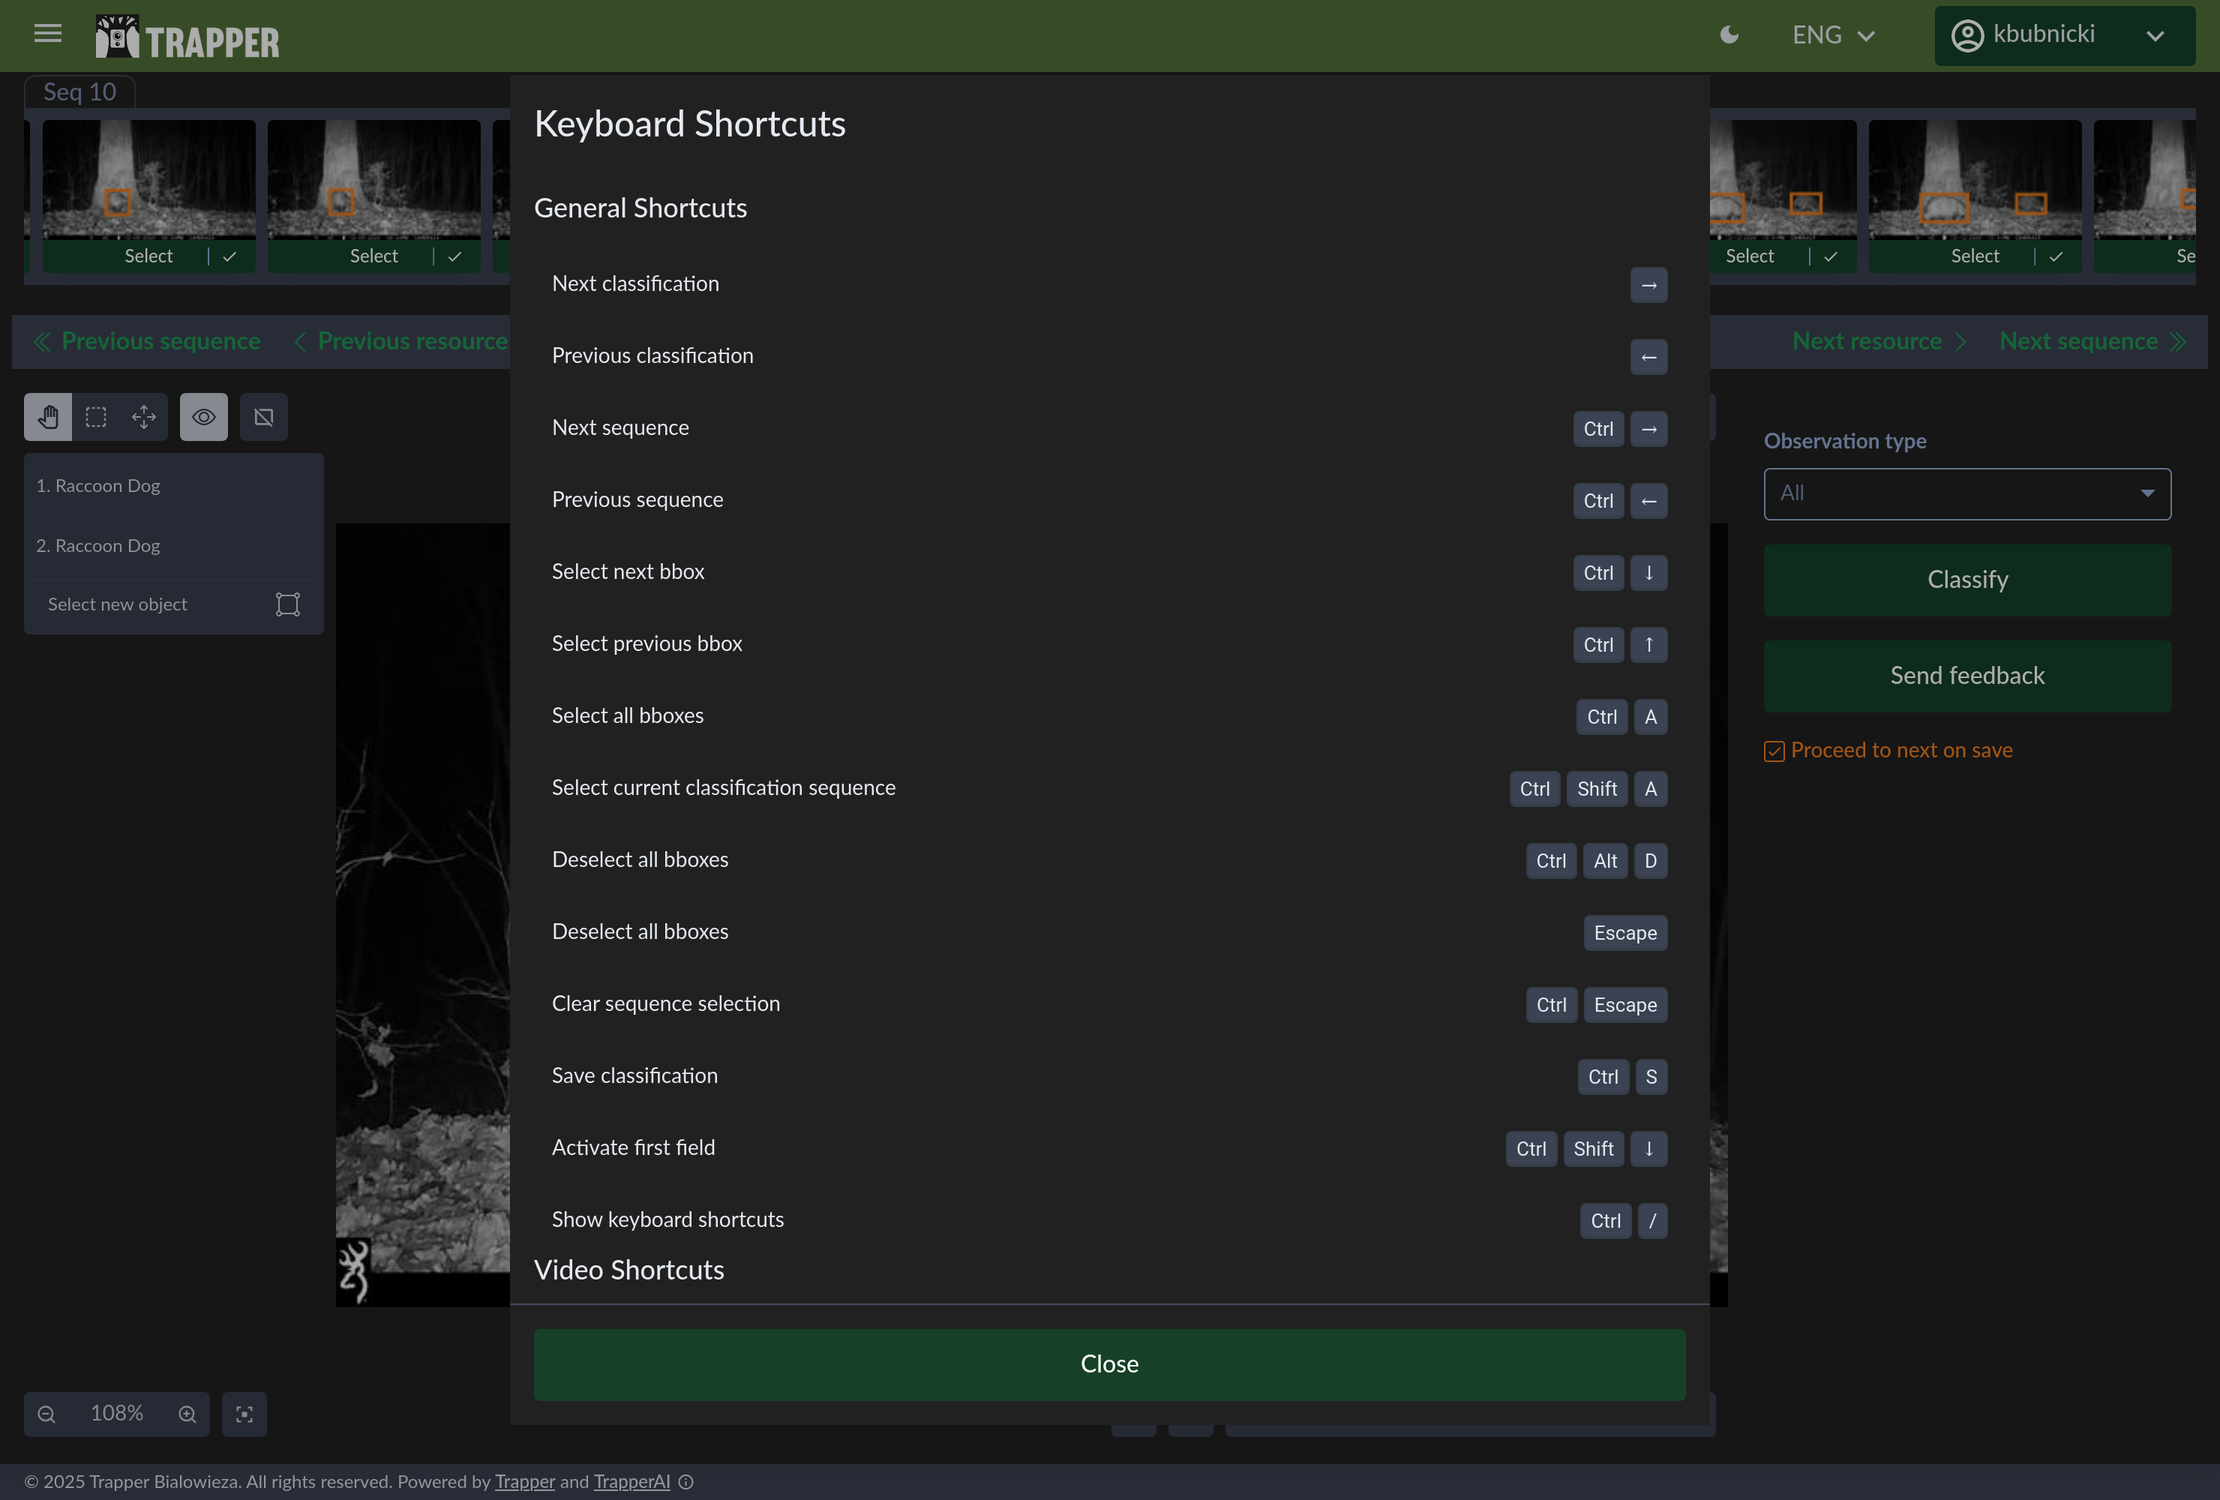
Access the full list of keyboard shortcuts to speed up your workflow.
The Interactive Canvas and On-the-Fly Filters
The main image viewer is more than just a picture frame; it’s an interactive canvas. This is your workspace for all annotation tasks. You can:
Draw new bounding boxes by clicking and dragging.
Select existing boxes to edit them.
Resize and move boxes for a perfect fit.
Zoom and pan to inspect details anywhere on the image.
To help with classification, especially in challenging lighting conditions, you can use on-the-fly image filters. Sliders for Contrast, Brightness, and Saturation are available directly in the interface. Adjusting these can reveal details in dark infrared shots or correct overexposed daytime images, ensuring you never miss an important visual cue.
Enhance your media in real time to make classification easier and more accurate. The empty bounding box labeled animal is shown for demonstration purposes only.
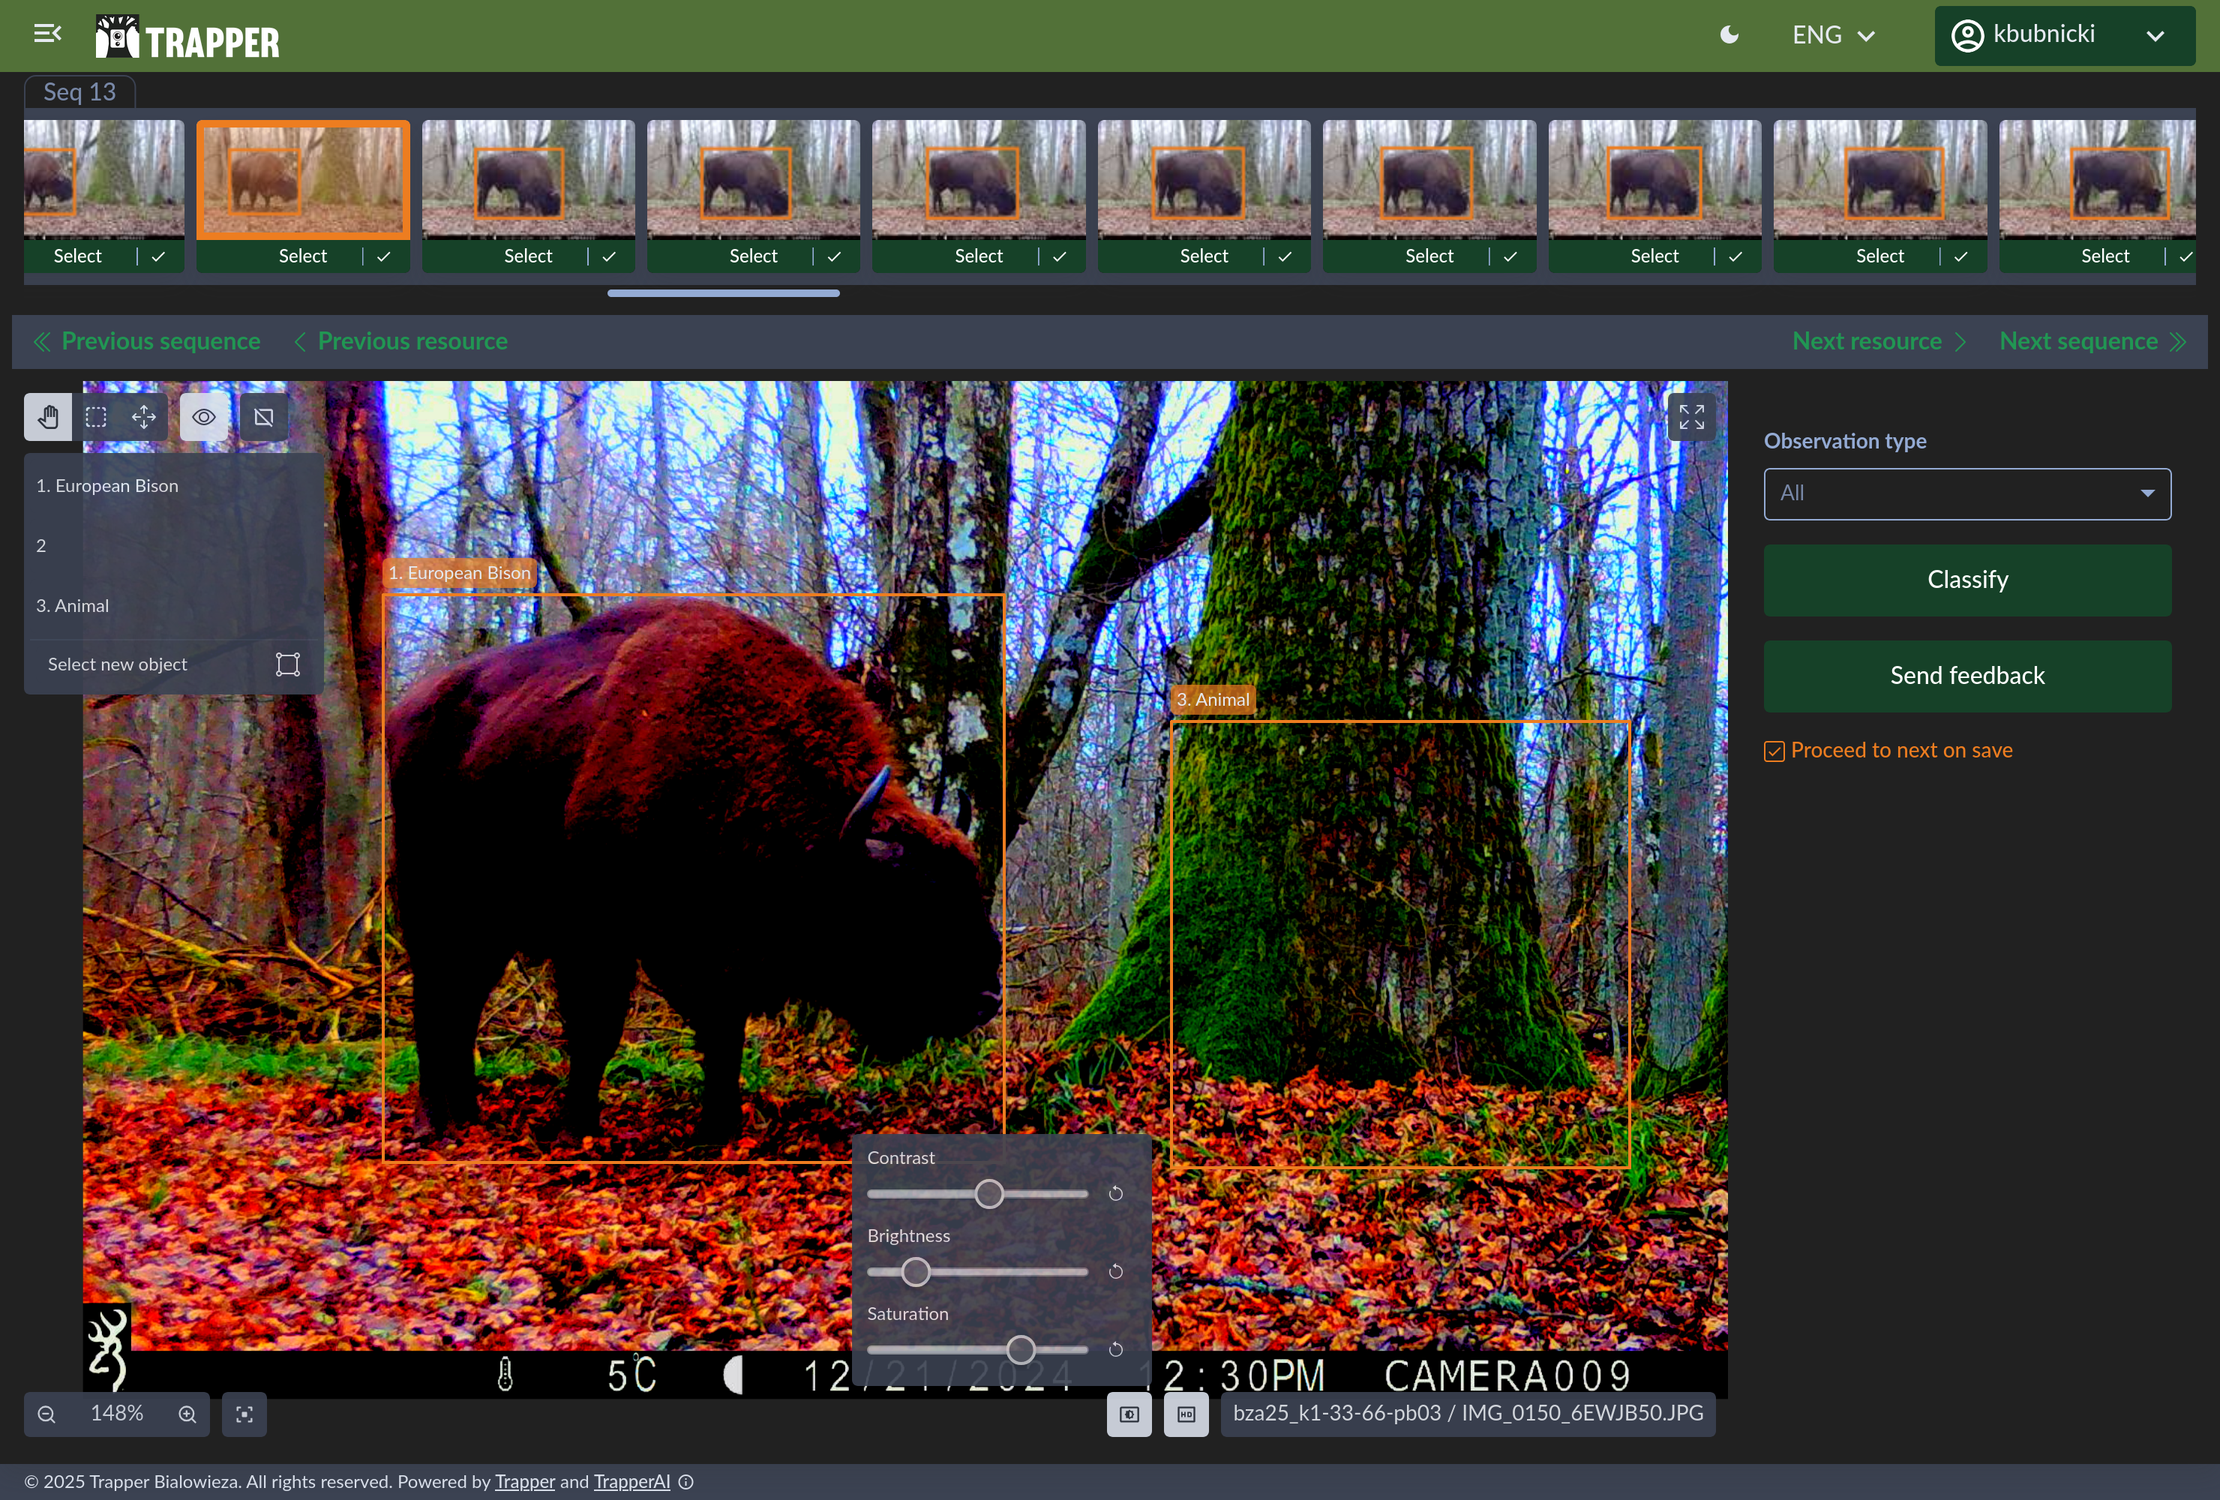
Flexible Annotation Modes
To accommodate different workflows and maximize speed, the interface supports multiple annotation modes:
Single Object Annotation: The most precise method. Click on a single bounding box. This will highlight it and open the classification form for that specific object.
All Objects on Image Annotation: To classify everything in the current view at once, you can select all objects on the image and apply a single classification to them.
Group Classification (Bulk Mode): This is the most efficient method for sequences with the same species. In the sequence thumbnail strip at the top, you can select multiple images. The interface will enter “Group classification mode”. Any classification you make will be applied to all objects in all the selected images. This is a massive time-saver.
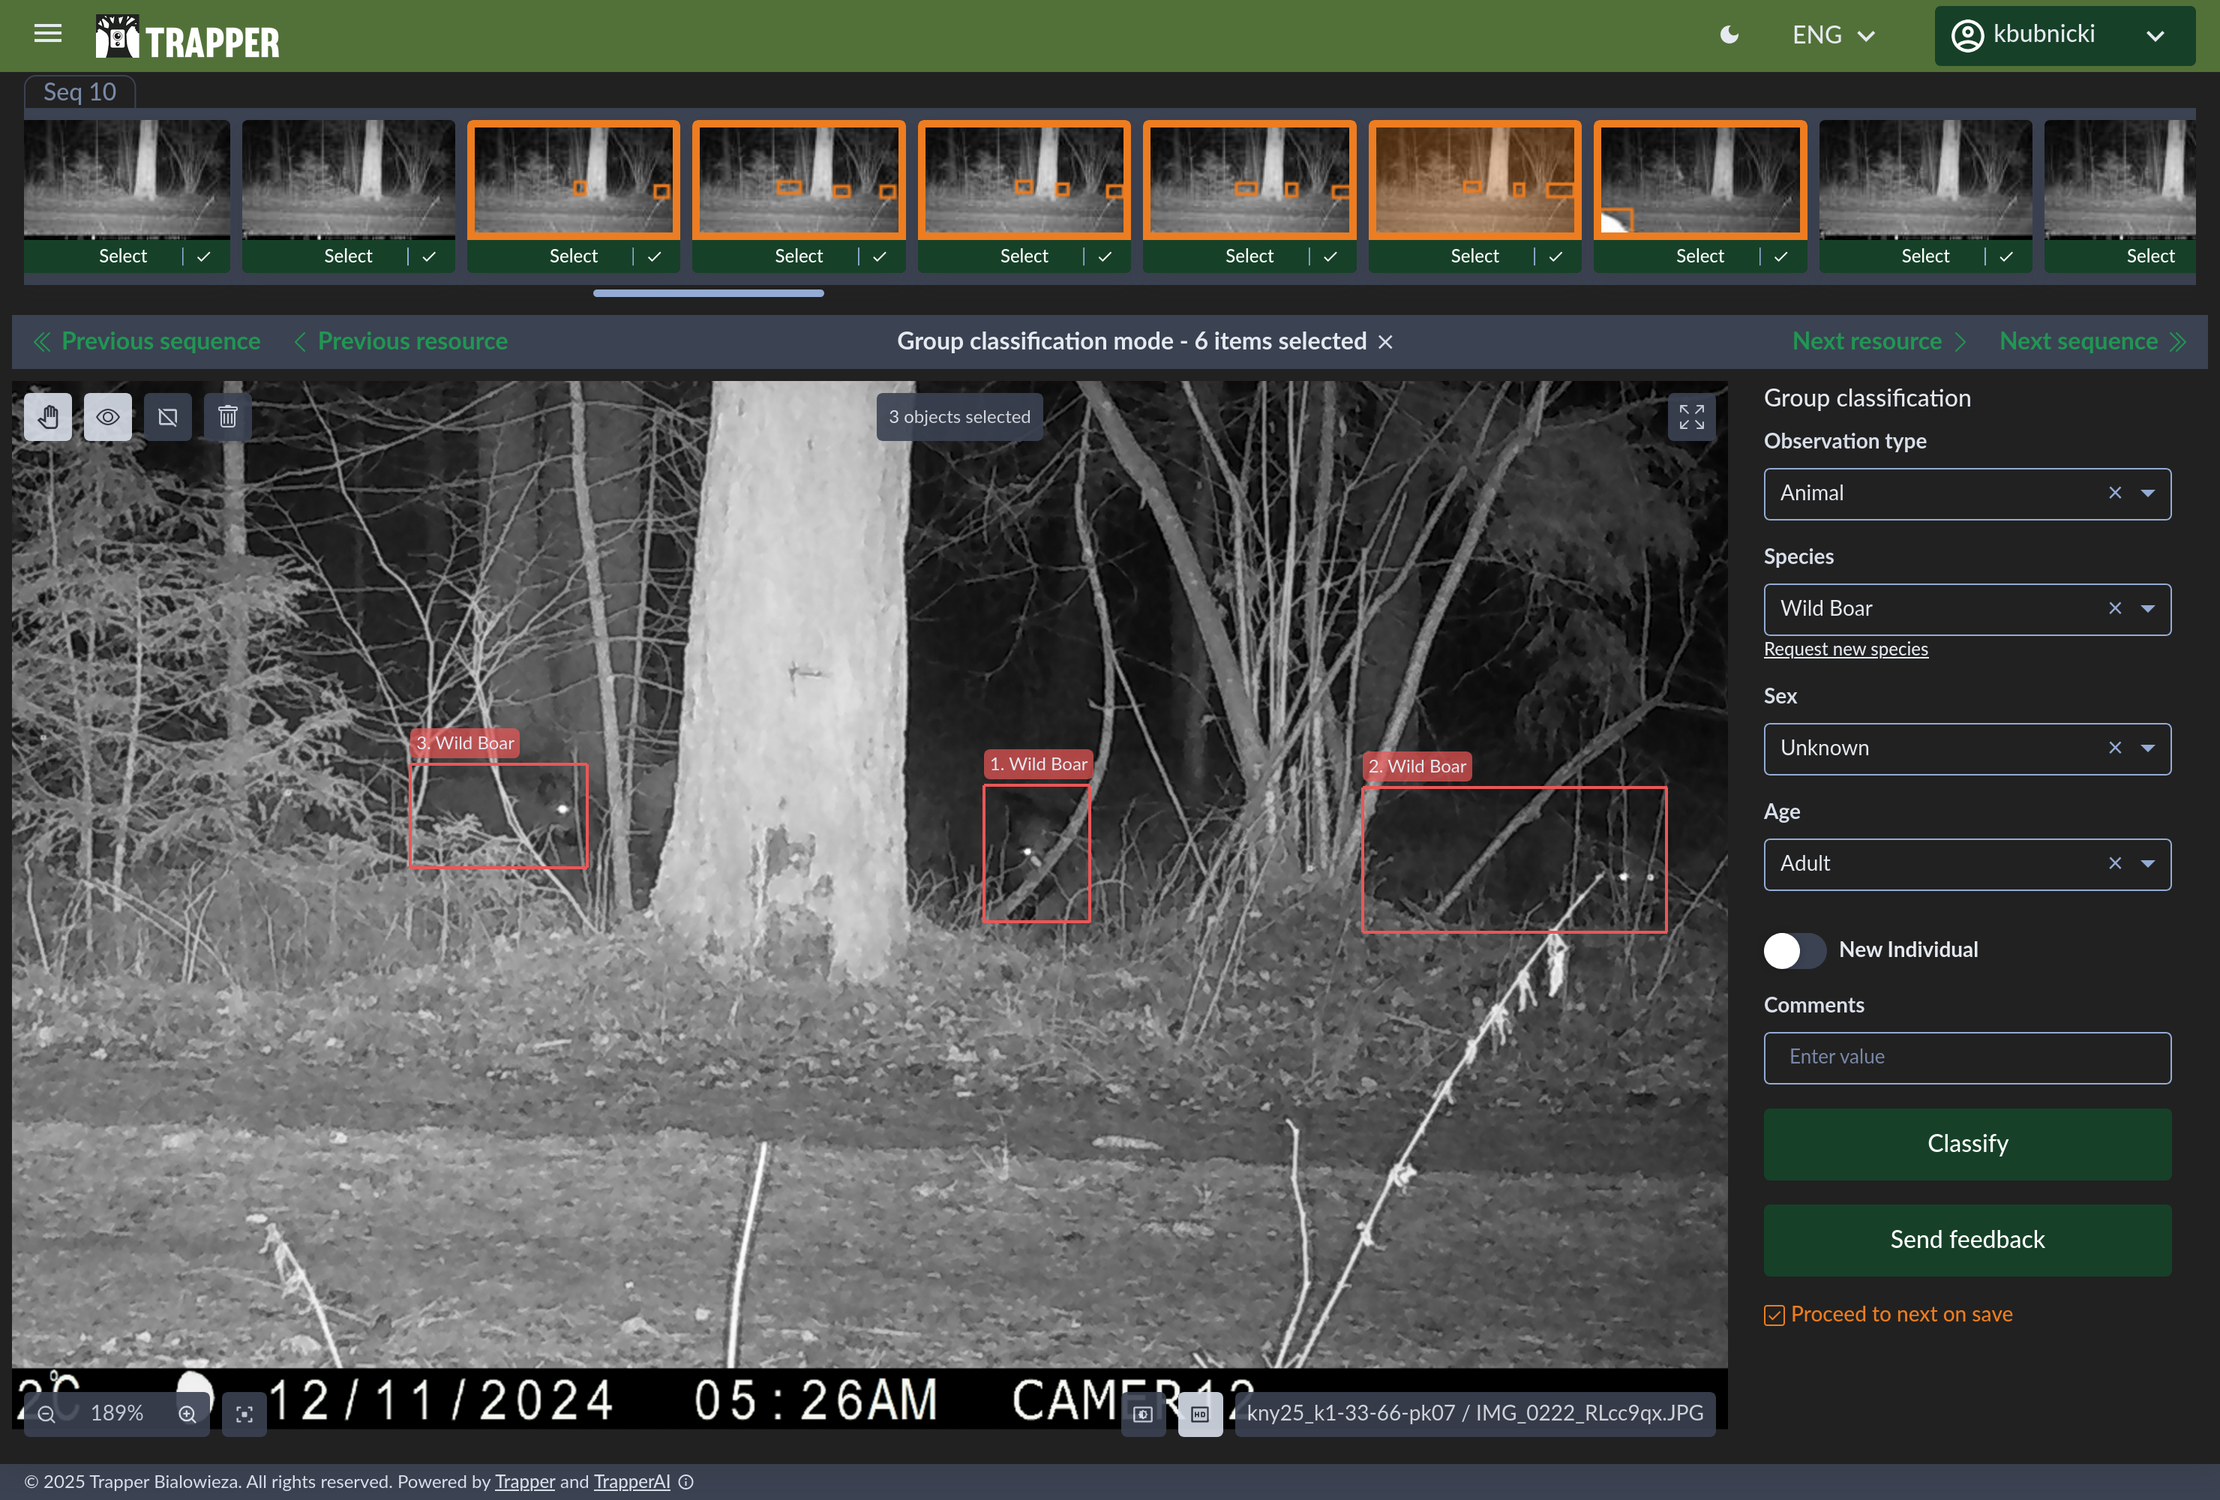
Classify entire parts of a sequence in a single action to dramatically speed up your workflow.
The Project-Specific Classification Form
When you select an object to classify, a form appears. This form is dynamic and project-specific.
Important
The fields you see (e.g., species, sex, age, number of individuals, behavior) are not hard-coded. They can be customized for each project by a project manager in the Trapper Expert module using a feature called the Classificator object. Some standardized fields are required for all classificators (for example observation_type and species), while others are optional (for example age and sex). All predefined fields conform to the Camtrap DP standard. Read more
The Classificator also allows you to define custom fields and assign a data type (e.g., string, integer, float, boolean) and validation rules. These settings enable automatic input validation in the UI to help ensure consistent, high-quality data. See the tutorial section 1. Create a Classificator for details.
For example, a project studying wolves might include custom metadata fields for howling_activity (boolean) and health_status (string | enum), while a project on roe deer might include fields for antler_development (boolean). This flexibility ensures that the data you collect is tailored to your research questions while remaining standardized for interoperability: all fields can be mapped to the Camtrap DP schema (e.g. custom fields can be exported as observationTags) so datasets are consistent, shareable, and machine‑readable across projects and platforms.
Managing Teams & Profile
Creating a Team
Collaboration is key! You can create teams to work on projects together. To share data and annotation efforts.
Go to the Teams section and click to create a new one.
Give your team a name and a description.
Use the map tools to draw a polygon defining your team’s primary area of interest. This helps organize your research efforts. You can also upload a GeoJSON or GPX file to define the area.
Note
Teams are a flexible self-organization tool for Trapper users — whether researchers, hunters, NGO staff, national park personnel, or volunteers — to coordinate fieldwork, share data and responsibilities, and organise annotation efforts. Teams support local collaboration while project permissions remain governed by administrators.
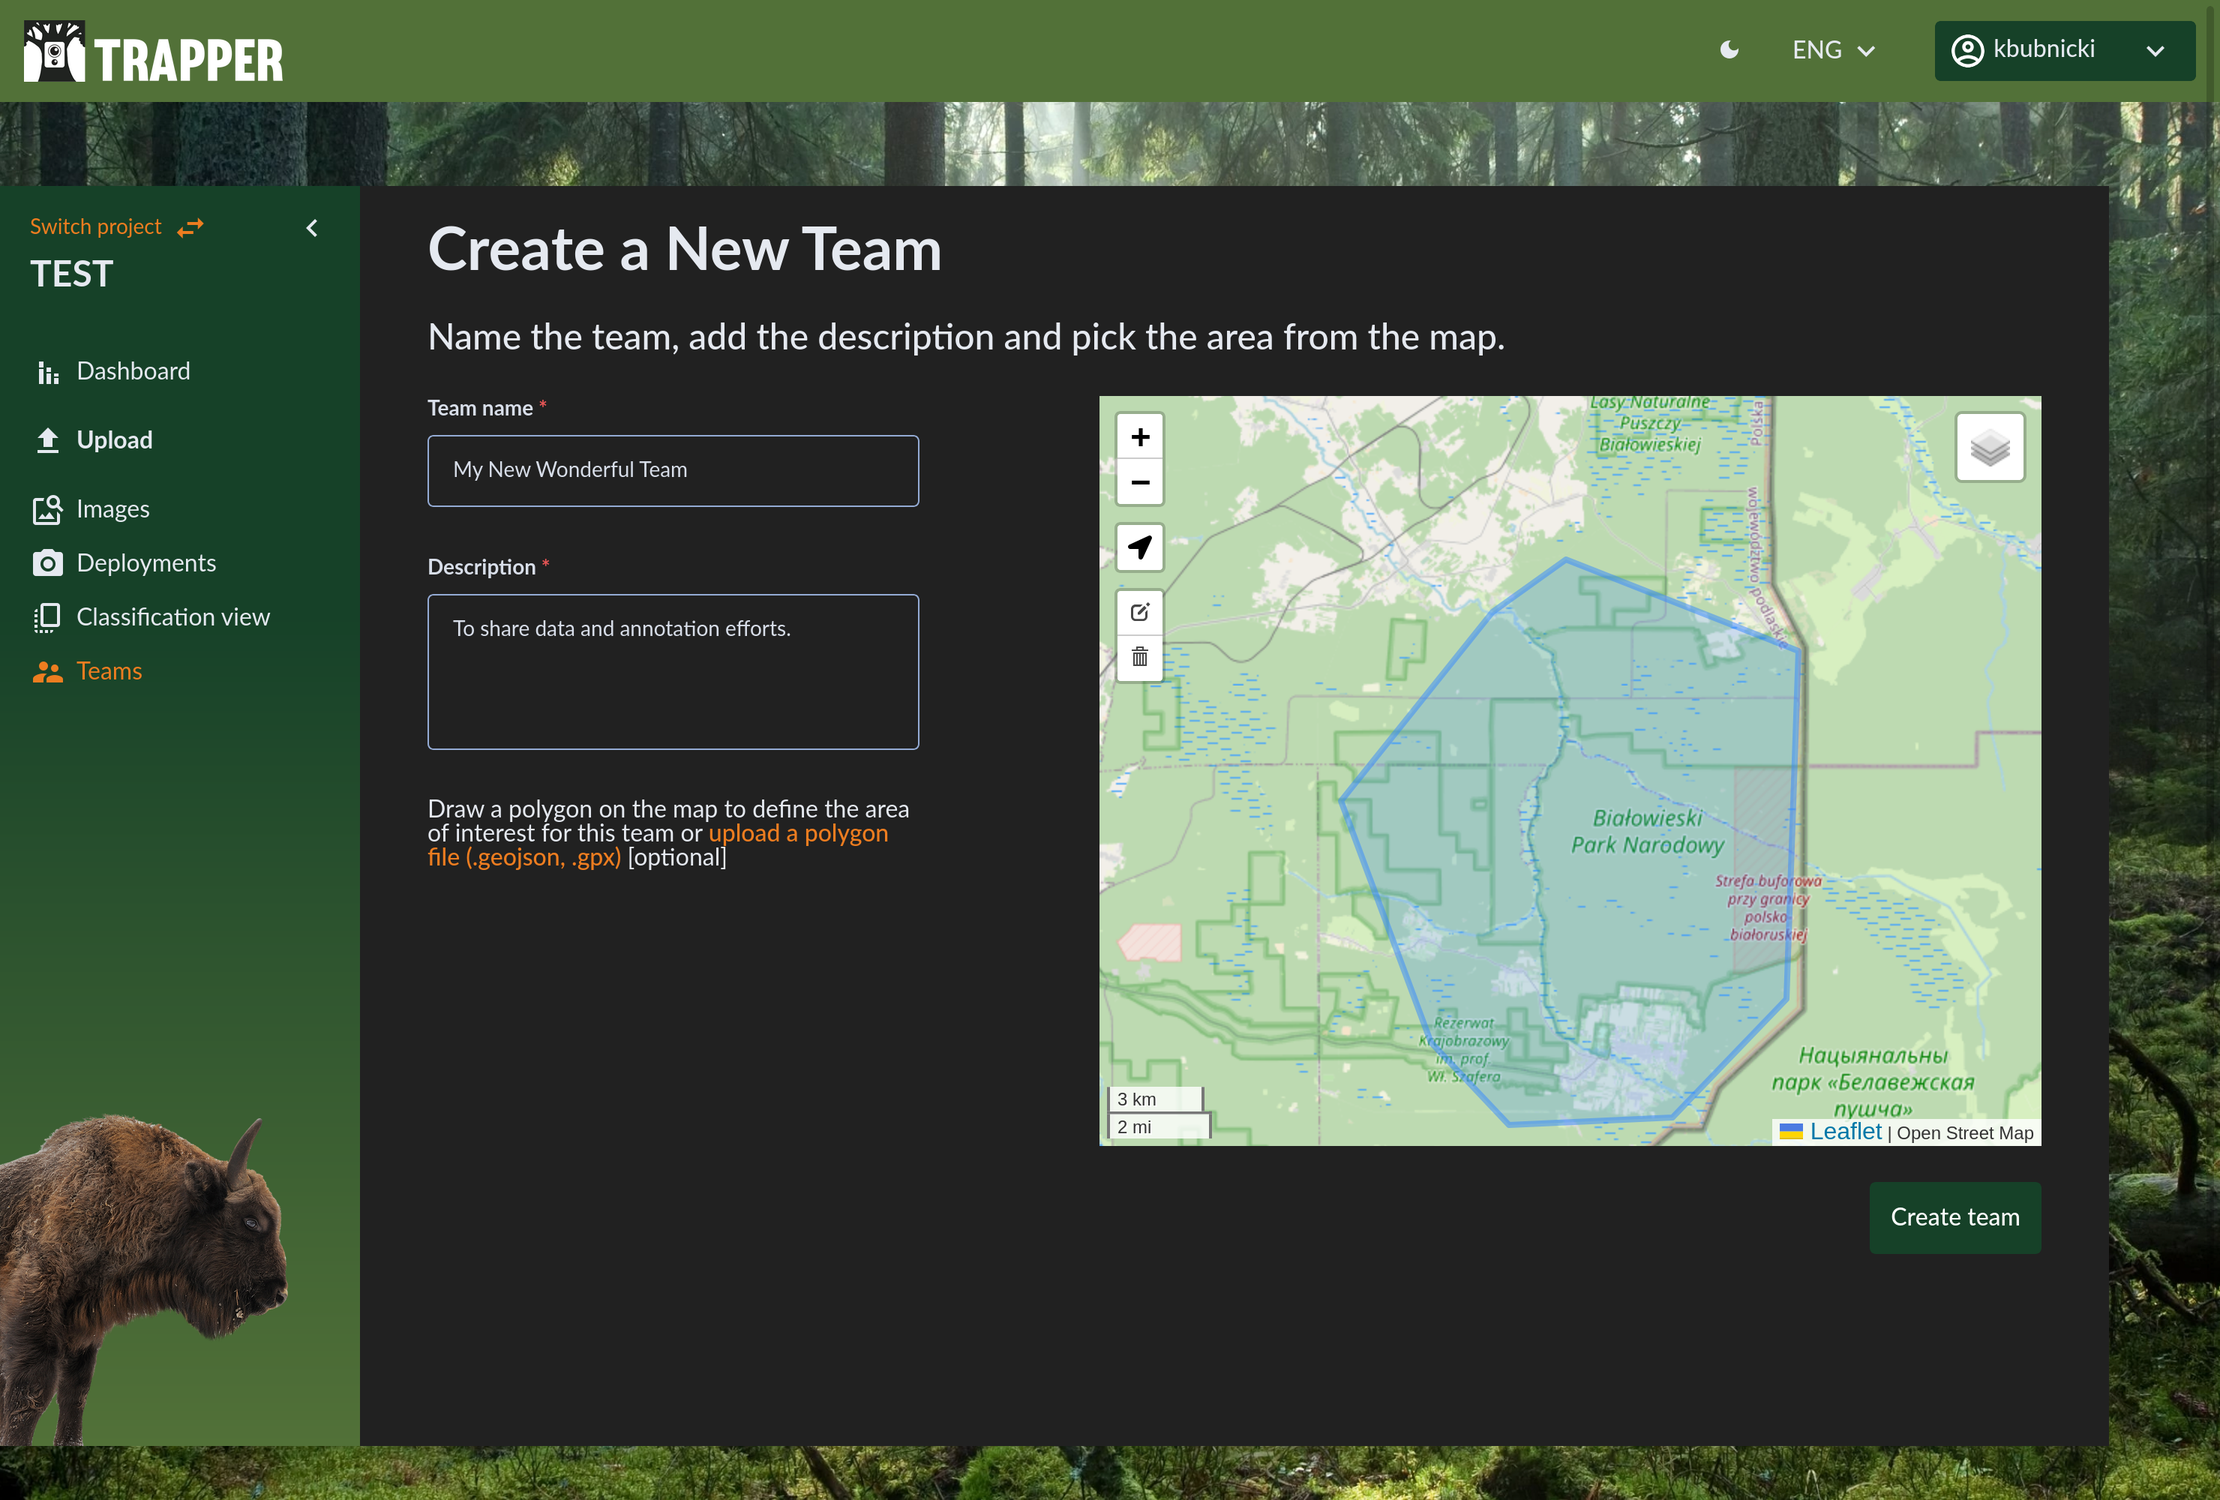
Organize your collaborative work by creating teams.
Profile and Settings
You can manage your personal information, change your password, change theme (light vs dark mode) and set your preferred language by clicking on your profile icon.
General: Update your email, username, first name, last name, phone number, institution, and write a short bio about yourself.
Change password: Update your password for security.
Multiple factor authentication: Enable two-factor authentication for added security.
Delete account: You have the option to delete your account.
Language: The interface supports multiple languages to accommodate our global community of users. You can switch between English, Swedish, Polish, and German.
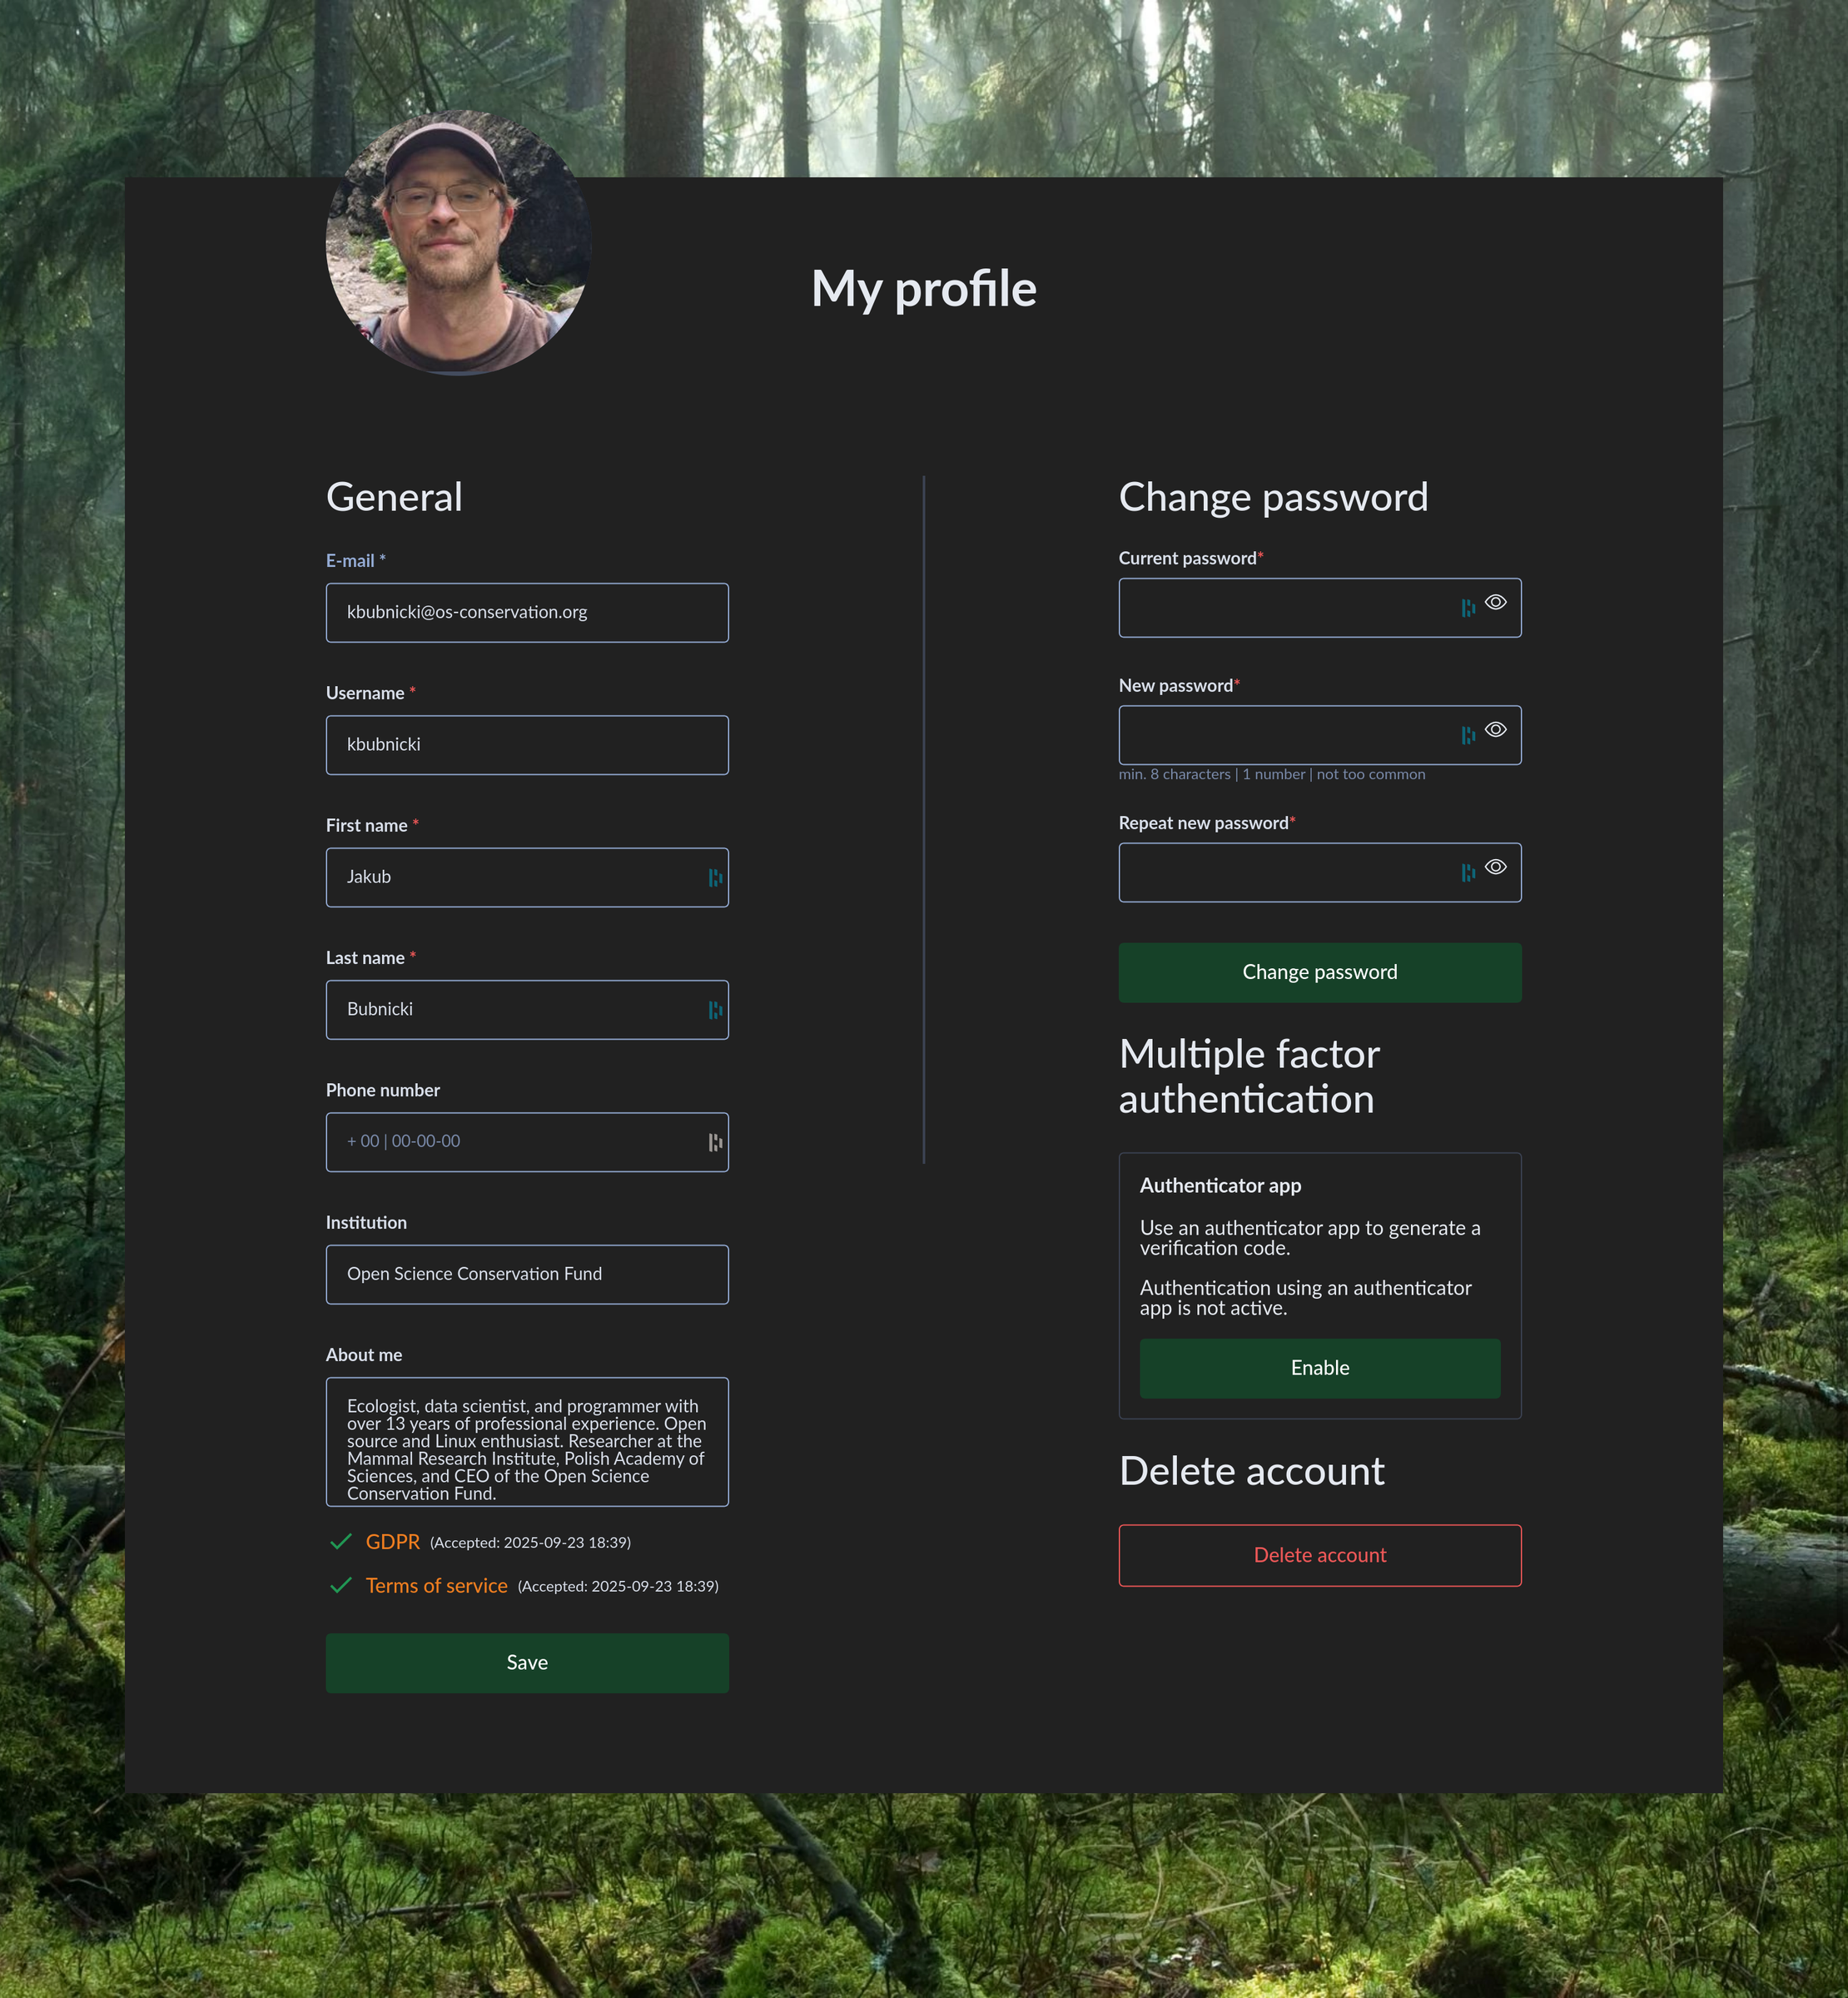
Keep your personal information up to date.
You’re now ready to master the Trapper Citizen Science Interface. Happy trapping! 📸🌲